Graphics Reference
In-Depth Information
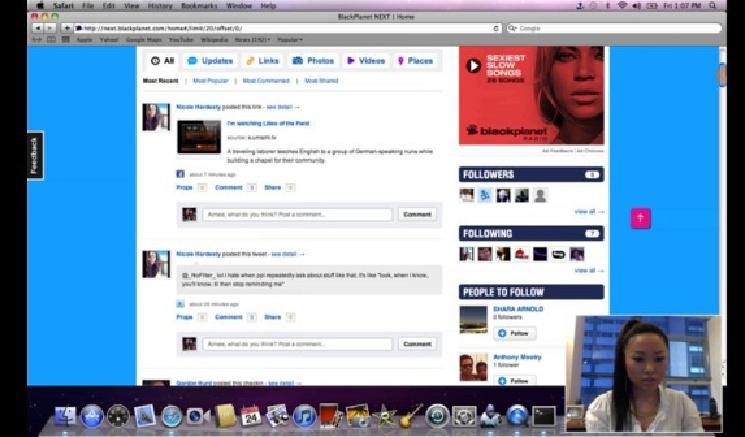
Figure 12 - Usability Testing with Silverback taught us a lot about how our users really
interacted with our software application.
When users arrived at the redesigned site, discernable features and tasks immediately
greeted them. The tasks were meant to be things users wanted and expected to do. They
went through the tasks, logging in, and signaling their likes and dislikes, and then they
began inviting friends to join. The biggest difference was that they now had a scaffolding
mechanism that pointed out obvious routes to the most desirable destinations. This made
even novice users more comfortable. Once they'd done these familiar tasks they would
have a fully populated webpage. Then they'd be ready to go.
We began testing our redesign with a new set of users. What we saw was the beginnings
of success. Our fresh test subjects were more engaged. Their interaction with the content
was much more smooth. Instead of staring at the screen, they were clicking on links and
icons, and entering their own data. As users' screens filled up, they stuck around. Finally,
they were doing what we'd hoped they'd do, creating a real social network.
Employing Ominture SiteCatalyst, we went live and watched the data come in. The 92
percent drop-off rate plummeted. Users stayed and invited more users. Ominture SiteCata-
lyst showed us how many users were active, how long they were active, and how they used
the various site components. We quickly saw that our biggest draw would be visuals. Our