Environmental Engineering Reference
In-Depth Information
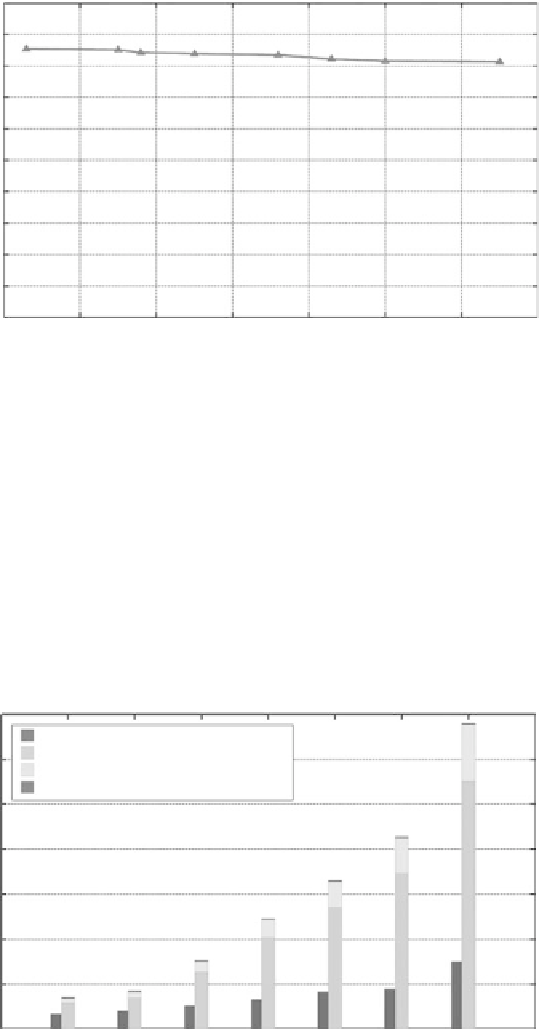
Eciency of MPPT Boost Converter (%) vs. Incoming Wind Speed (m/s)
100
90
80
70
60
50
40
30
20
10
0
2
3
4
5
Incoming Wind Speed (m/s)
6
7
8
9
FIGURE 2.16
Efficiency of an MPPT boost converter for various incoming wind speeds.
Taking into account both the power loss across the boost converter and the
power loss in the associated control, sensing, and PWM generation circuits
mentioned in
Equations 2.7
and
2.8
,
respectively, the performance comparison
between the WEH system with MPPT and without MPPT are tabulated in the
bar chart shown in
Figure 2.17
. For all the wind speed measurement points
shown in
Figure 2.17
, it is observed that the performance of the WEH system
with MPPT, including the converter's efficiency loss and circuits' power loss,
Performance Comparison between WEH without MPPT and with MPPT
Plus Associated Losses
70
WEH without MPPT
WEH with MPPT
Eciency loss in converter
Power loss in ctrl and sensing circuits
60
50
40
30
20
10
0
1
2
3 4
Wind Speed Measurement Points
5
6
7
FIGURE 2.17
Performance comparison between the WEH system without MPPT and the WEH system with
MPPT plus its associated losses for various incoming wind speeds.


Search WWH ::

Custom Search