Environmental Engineering Reference
In-Depth Information
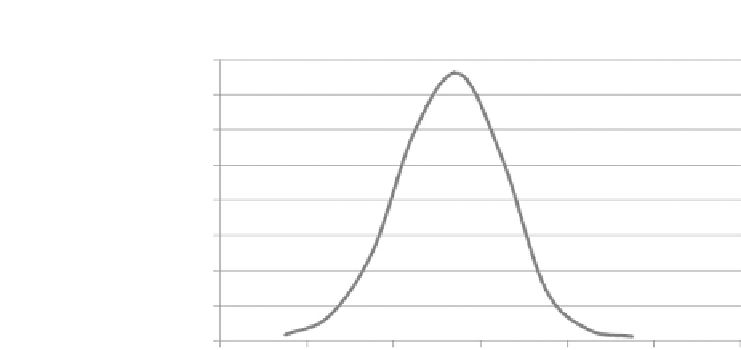
Eciency vs. Frequency
80
70
60
50
40
30
20
10
0
1.5
1.7
1.9
2.1
2.3
2.5
2.7
Frequency (MHz)
FIGURE 6.20
Experimental efficiency of a WPT for various operating frequencies.
6.2.3.1 Experimental Efficiency versus Frequency
Referring to the simulation shown in Section 6.2.2, the simulation results
showed that the efficiency of the WPT system was maximum for an opti-
mal operating frequency. This optimum efficiency was the strongly coupled
regime where
/
1 and maximum power transfer took place. As the op-
erating frequency shifted away from the strongly coupled regime, the WPT
system efficiency started to decrease. The same deduction is also achieved,
and its experimental results are plotted in
Figure 6.20
.
Figure 6.20
verifies that the resonant frequency of the WPT system of 2.05
MHz was well within the simulated frequency band of 1 to 40 MHz. At res-
onance, the maximum obtainable efficiency of the WPT system was around
75%
10%,
it can be observed from
Figure 6.20
that the WPT efficiency dropped tremen-
dously to less than 15%. It is necessary to design the WPT coils to operate at
resonance using
Equation 6.2
to achieve efficient wireless power transmission.
.
Shifting away from the resonant frequency of 2.05 MHz by around
±
6.2.3.2 Experimental Efficiency versus Distance
In this experiment, the operating frequency of the power source was set at
the resonance of the WPT system of 2.05 MHz, and the separation distance
between the transmitting and receiving coils was tested over a transmis-
sion range of 40 cm. The experimental results are collected and plotted in
Referring to
Figure 6.21
, it was observed that the efficiency of the WPT sys-
tem was maximum at a separation distance of 20 cm. Beyond the distance of
20 cm where the coils are separated even further, the mutual coupling between
the transmitting and receiving coils became weaker and weaker, so less and


Search WWH ::

Custom Search