Environmental Engineering Reference
In-Depth Information
MAX 666
SENSE
C
1 uF
R1
27.5 K
V
IN
N4148
V
OUT2
R4
150 K
SHDN
C1
47 uF
Q1
V
SET
GND
Core
Z1
6.2 V
1N4738A
C
33 uF
R3
940 K
AC
R5
100 K
R2
6.75 K
Inductive Energy
Tr ansfer Core
Voltage
Doubler
(Single Stage)
Q2
Power Storage and Supply Circuit
Linear Regulator
HT12E
A0
A1
A2
A3
A4
A5
A6
A7
VSS
VDD
DOUT
OSC1
OSC2
/TE
AD11
AD10
AD9
AD8
AM-RT4-433FR
750 K
V
cc
GND
ANT
IN
RF Load
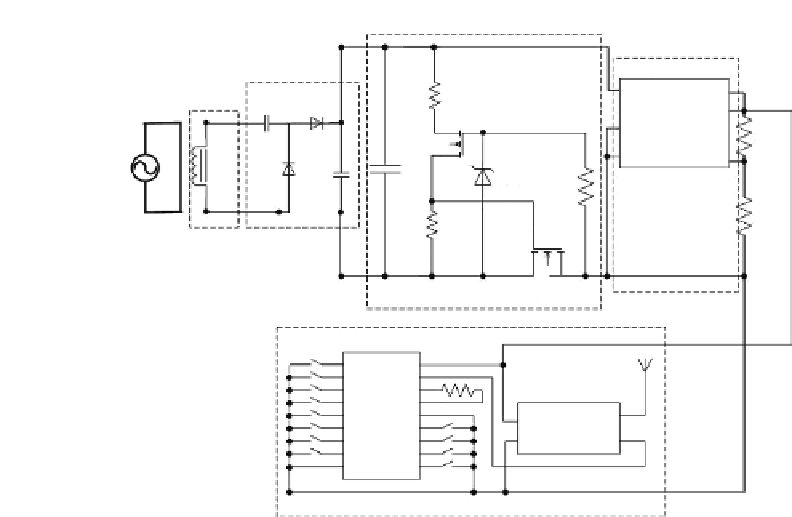
FIGURE 6.9
Schematic drawing of the magnetic energy harvesting system.
throughout the discharge of C1. When the voltage across C1 dropped below
around 4 V, the voltage drop across R3 caused Q1 to turn off and hence in
turn deactivated Q2 from the latched stage. When this happened, the ground
lines of MAX666 and AM-RTFQ1-433 were disconnected from C1, and the
discharge of C1 was stopped. As the secondary coil of the transformer con-
tinued to induce
V
emf
to the voltage doubler and increased the voltage on C1,
the cycle started again.
6.1.3
Experimental Results
An experimental platform, which consisted of a 220/230
V
ac
power supply
connected to a bank of load resistances of 60
, was set up as shown in
Figure 6.10
to emulate the electrical current of 1 to 4 A flowing in the power
line [167]. Since the primary side power line was AC, the induced emf would
be AC voltage. This experimental setup was used as a testing platform to
evaluate the performance of the magnetic energy harvesting system.
of the stray magnetic energy harvester and the output DC voltage of voltage
doubler circuit. It can be observed that the induced voltage signal is a distorted
sinusoidal wave rather than a smooth sinusoidal wave. The reason for this
phenomenon may be due to the magnetic hysteresis effect and the magnetic
saturation of the toroid core.


Search WWH ::

Custom Search