Environmental Engineering Reference
In-Depth Information
20 S/s
50 s/div
CH1 10 : 1
0.500 V/div
DC Full
CH2 10 : 1
0.500 V/div
DC Full
CH3 10 : 1
1.00 V/div
DC Full
CH4 10 : 1
1.00 V/div
DC Full
<< Main : 10 k>>
3.3 V
3.35 V
3.1 V
3.1 V
3.1 V
V
cap
V
solar
2.94 V
I
wind, scaled
V
solar
2.58 V
T
8.15 V
1.2 V
V
wind, scaled
A
90 secs
SEH
@MPPT
B1
100 secs
No SEH and
No WEH
C
80 secs
SEH w/o
MPPT
D
130 secs
WEH
@MPPT
B2
50 sec
No SEH
& WEH
E
50 sec
WEH w/o
MPPT
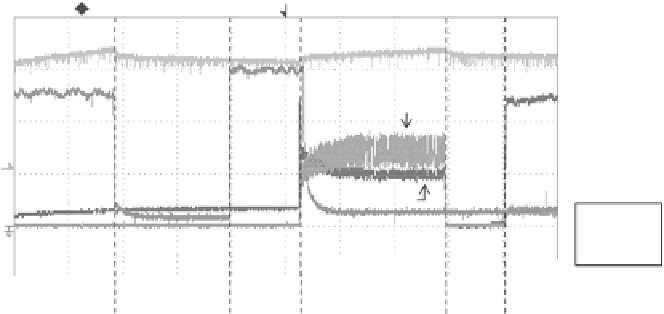
FIGURE 5.14
Operation of a sensor node under various powering schemes.
In region D of
Figure 5.14
, the WEH subsystem with an RE-based MPPT
scheme was employed. It is observed from
Figure 5.14
that the output voltage
of the supercapacitor
V
cap
increased from 3.1 to 3.35 V in 130 s. Referring to
DC voltage of wind turbine generator: multiply experimental value by 2.2 to
get actual voltage), is 1.2 V, while its current
I
wind,scaled
(scaled voltage equiva-
lent of DC current of wind turbine generator: multiply experimental value by
0.01 to get actual current in amperes) is 8.15 mA. Hence, the calculated resis-
tance of
R
em
=
1
.
2
V
=
147
was equivalent to the emulated resistance of
8
.
15 mA
150
. This equivalence shows that the WEH subsystem was operating at near
its MPP, and it was able to harvest around 9.5 mW of electrical power at an
average wind speed of 4 m/s. However, in region B2 of
Figure 5.14
, when the
WEH subsystem was disconnected from the load, the output voltage of the
supercapacitor
V
cap
falls back to 3.1 V in 50 s. In region E, it is observed that
the supercapacitor's voltage continued to decrease even though wind energy
was being harvested again but not at MPPT. The reason is that the voltage
and current at the input of the boost converter of the WEH subsystem without
MPPT was no longer controlled, resulting in much less harvested power. As
such, MPPT was important for optimal and effective EH performance of the
WEH and SEH subsystems.
Another set of experiments was conducted to evaluate the performance of
the HEH system in comparison with the WEH and SEH subsystems individ-
ually. The outcome of the performance comparison between a single-source-
based EH system and a multiple-source-based energy harvesting system is
illustrated in
Figure 5.15
.
Referring to
Figure 5.15
, it can be observed from regions A and C that
the single-source EH systems (i.e., SEH and WEH) operating in MPPT mode
were able to charge the 1.5-F supercapacitor as well as power their associated
sensing and control circuit and wireless sensor node. The electrical power


Search WWH ::

Custom Search