Environmental Engineering Reference
In-Depth Information
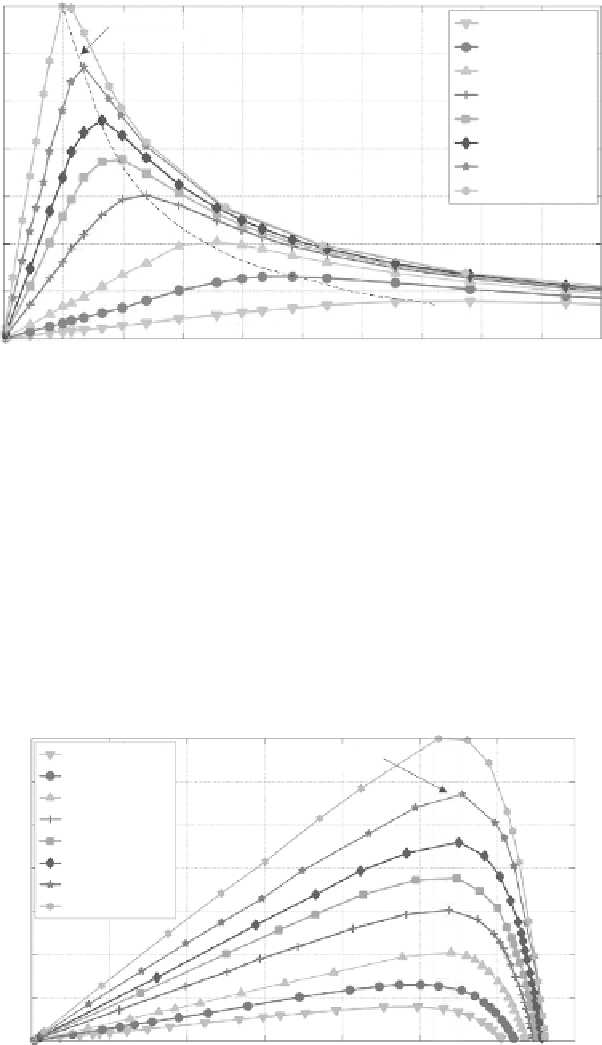
Electrical Power Generated (mW) vs. Load Resistance (Ω)
140
Maximum
Power Points
G
= 80 W/m
2
G
= 130 W/m
2
120
= 200 W/m
2
G
= 300 W/m
2
G
= 400 W/m
2
G
= 500 W/m
2
G
G
100
80
= 650 W/m
2
= 800 W/m
2
G
60
40
20
0
0
50
100
150
200
250
Load Resistance (Ω)
300
350
400
450
500
FIGURE 5.4
Power curves of a solar panel over a range of load resistances.
their characteristics are totally different. Unlike the wind turbine generator's
characteristic observed in Figure 2.4 where its internal impedance is almost
the same for all incoming wind speeds, the internal impedance of the solar
panel varies with the changing solar irradiance.
the solar panel at which the harvested power is maximum is within a small
voltage range of 2.55 to 2.75 V for different solar irradiances. The maximum
Electrical Power Generated (mW) vs. Voltage (V)
140
Maximum
Power Points
G
= 80 W/m
2
G
= 130 W/m
2
G
120
= 200 W/m
2
G
= 300 W/m
2
G
100
= 400 W/m
2
G
= 500 W/m
2
G
= 650 W/m
2
G
80
= 800 W/m
2
60
40
20
0
0
0.5
1
1.5
2
2.5
3
3.5
Voltage (V)
FIGURE 5.5
Power harvested by a solar panel plot against generated voltage for a range of solar irradiance.


Search WWH ::

Custom Search