Environmental Engineering Reference
In-Depth Information
TABLE 4.2
Maximum Energy Available for Harvesting under Various Input Forces
Input Force
Peak Voltage
Time Span
Energy Harvested
(N)
(V)
(s)
mJ
Light / 1
73.3
1.112
0.88
Normal / 5
86.7
0.846
1.23
Heavy / 10
112.5
0.721
2.08
forces provided by a human's thumb pressing.
Apart from determining the optimal load condition, the optimal capaci-
tance that maximum energy can be transferred from the piezoelectric mate-
rial and stored into the external storage capacitor has to be investigated as
well. In this experimental test, the load connected to the output terminal of
piezoelectric material is a capacitor with capacitance values ranging from 150
nF to 33
F. The experiments are conducted to investigate the performance
of the piezoelectric material in terms of its generated peak voltage and har-
vested energy for different capacitor values, and their experimental results
are illustrated in
Figures 4.20
and
4.21
.
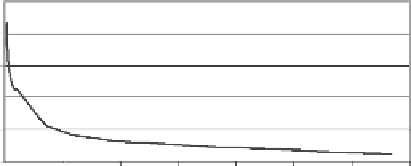
Referring to
Figure 4.20
, it can be observed that the peak voltage generated
across the capacitor falls with the capacitance value of the external capacitor.
Based on the principle of conservation of charges,
Q
CV
,asthe capacitance
value increases, while the generated charges remain unchanged, the voltage
developed across the capacitor decreases. This is the voltage clamping ef-
fect of the capacitor. Similarly, with reference to
Figure 4.21
, it can be seen
that the electrical energy stored in the capacitor decreases as the capacitance
value increases. According to Shenck [101], if there is impedance mismatch
between the source capacitance of piezoelectric material and the load capac-
itance, energy loss is bound to occur in the energy transfer process. Hence,
transferring energy from a fixed capacitor (source capacitor) to an increasingly
large capacitor will result in greater mismatch and higher losses. Among the
=
Energy Stored vs. Capacitance
100
80
60
40
20
0
0
5
10
15
Capacitance/uF
20
25
30
35
FIGURE 4.20
Peak output voltage generated at various capacitance values.


Search WWH ::

Custom Search