Environmental Engineering Reference
In-Depth Information
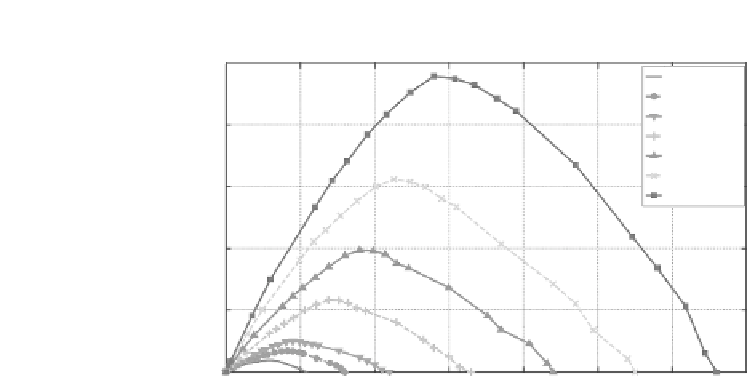
Harvested Electrical Power (µW) vs. Electrical Voltage (V)
2500
T
∆
= 5 K
∆
= 7 K
∆
T
= 10 K
∆
T
= 15 K
∆
T
2000
T
= 20 K
∆
T
= 25 K
1500
T
∆
= 30 K
1000
500
0
0
5
10
15
20
25
30
35
Electrical Voltage (V)
FIGURE 3.3
P-R curves of thermoelectric generator at different thermal gradients.
3.1.3
Characterization of a Thermal Energy Harvester
Based on the thermal analysis, the thermal energy harvester has been designed
to maximize the overall output power of the TEG. The geometric design pa-
rameters, such as
x
and
A
, and the thermal interface-related parameters are
the main design factors of the thermal energy harvester. The physical size of
the optimized thermal energy harvester prototype is 20 x 20 x 20 mm. Some
characterization works are performed by applying a temperature difference
(
T
H
−
T
C
) between the energy harvester faces and measuring both the out-
put voltage and the current with different loads connected. This operation is
repeated for temperature differences in the range between 5 and 30 K.
Referring to the power curve (power versus load voltage) shown in
Figure 3.4
, it can be observed that the maximum obtainable power for each
thermal gradient corresponds to an output voltage of the thermal energy
harvester. This is unlike the case of the other energy harvesting sources like
solar, vibration, and so on, where their power curves peak near a particular
output voltage of the energy source. As such, it is not possible to utilize this
simple and ultralow-power MPPT approach, that is, fixed reference voltage
to the thermal energy harvester. In order to overcome that, Kim et al. [90]
propose the adaptive and tracking MPPT approaches that are suitable for
TEH; however, these energy-hungry approaches require high computational
power and cost with respect to the milliwatt or even lower harvested power
levels of interest in this chapter.
Since most of the conventional MPPT approaches are not suitable for TEH,
this chapter presents an alternative MPPT technique based on the concept of
emulating the load impedance to match the source impedance as illustrated by
the power curves in
Figure 3.3
. This technique is also known as the resistor
emulation or impedance matching approach. The power curve plotted in


Search WWH ::

Custom Search