Information Technology Reference
In-Depth Information
2
1.8
1.6
1.4
1.2
1
0.8
0.6
0.4
0.2
0
0
2
4
6
8
10
12
14
16
18
20
t
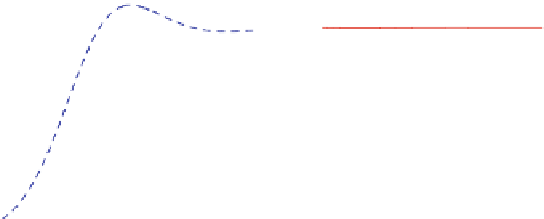
Fig. 3.2
The numerical solution for system (
3.20
)and(
3.21
), produced by the explicit scheme
(
3.22
)and(
3.23
)usingt
D
0:1. The solution for F is represented
by the
solid curve
, whereas the solution for S is represented by the
dashed curve
1=1;000, F
0
D
1:9,andS
0
D
3.4
Phase Plane Analysis
3.4.1
A Simplified Model
Let us consider the simplified model
F
0
.t /
D
1
S.t/; F.0/
D
F
0
;
S
0
.t /
D
F.t/
1; S.0/
D
S
0
:
(3.24)
This model represents the very basic properties
5
of the fish-shark interaction. We
observe that a large number of sharks (S>1) leads to a decrease in the fish popu-
lation (F
0
<0), and that a large number of fish (F>1) leads to an increase in the
number of sharks (S
0
>0).
5
Note that (
3.24
) is not a realistic model for the fish-shark interaction. It may produce negative
values, which are clearly not relevant. We introduce the model here only in order to illustrate
properties of ordinary ODEs and their numerical solution.