Information Technology Reference
In-Depth Information
x
10
10
2.6
2.4
2.2
2
1.8
1.6
1.4
1.2
1
0.8
0.6
2000
2010
2020
2030
2040
2050
2060
2070
2080
2090
2100
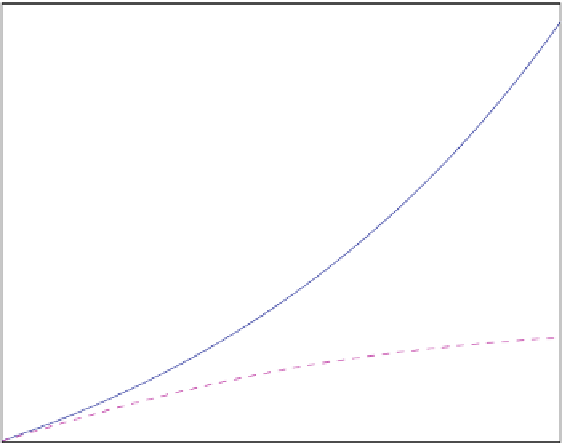
Fig. 5.14
Models of the population growth on the Earth based on an exponential model (
solid
curve
) and a logistic model (
dashed curve
)
efforts at birth control have limited the population growth. This may be the reason
for the rather low estimates on future growth issued recently. Note also that a differ-
ent way of estimating the growth rate ˛ and the carrying capacity ˇ leads to much
lower estimates, see Project
5.5
.
5.3
Least Squares Approximations of Functions
We have seen how to make models of discrete data sets and how to apply these
techniques to generate coefficients in models of population growth. Now we will
face a different but related problem: Suppose we have data given by a function
y
D
y.t/. How can we make a linear model of such a function? Suppose we are
interested in the function
y.t/
D
ln
1
10
sin.t /
C
e
t
:
(5.102)
This function is plotted in Fig.
5.15
and we observe that y is almost linear. It is
not completely trivial to read this from (
5.102
). But based on the graph, it seems
appropriate to approximate y by a linear function. Just by guessing