Information Technology Reference
In-Depth Information
0.6
0.4
0.2
0
−0.2
−0.4
−0.6
1850
1900
1950
2000
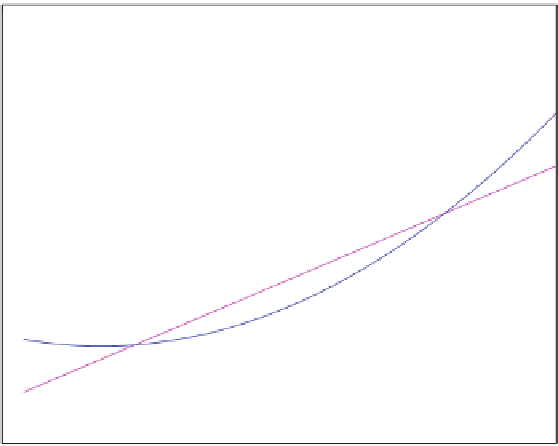
Fig. 5.12
Constant, linear and quadratic approximations of global annual mean temperature
deviation measurements (relative to the 1961-1990 mean); from 1856 to 2000
0
1
0
1
0
1
145 10585 1026745
10
6
10585 1026745
10
6
1:12042
10
8
1026745
10
6
1:12042
10
8
1:30415
10
10
˛
ˇ
21:82
502:43
19649:8
@
A
@
A
D
@
A
:
(5.70)
The solution of this system is given by
ˇ
1:8404
10
3
;
4:2005
10
5
;
˛
0:3136;
and
so the quadratic model is given by
p
2
.t /
0:3136
1:8404
10
3
t
C
4:2005
10
5
t
2
:
(5.71)
In Fig.
5.12
we have plotted the data points, the constant approximation p
0
.t /,the
linear approximation p
1
.t / and the quadratic approximation p
2
.t /.
5.2
Application to Population Models
In Chaps. 2 and 3 above, we studied various population models. For instance, we
suggested that the growth of populations in environments with unlimited resources
can be modeled by the ordinary differential equation