HTML and CSS Reference
In-Depth Information
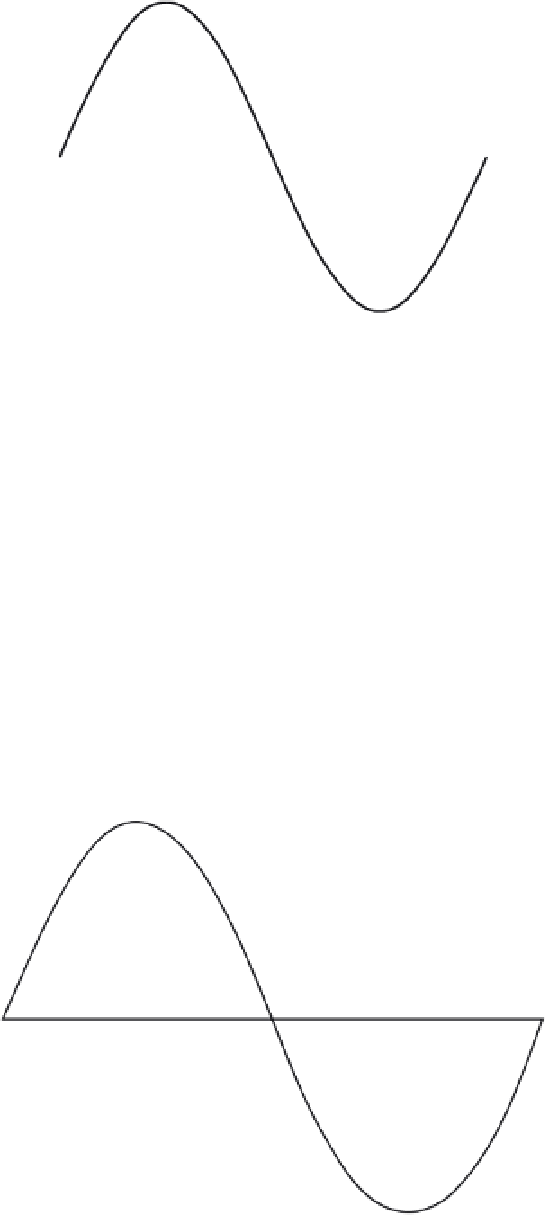
Figure 3-17.
A sine wave
But what exactly does that shape have to do with the sine function? It is the graph of the results of the sine
function, when fed in all the angles from 0 to 360 (or 0 to 2 pi in radians). From left to right is the value of
the angle used, and the y value of the graph is the sine of that particular angle. In Figure 3-18, we indicate
some specific values.
Now you can see that the sine of 0 is 0. The sine of 90 degrees, or pi/2 radians, is 1. The sine of 180
degrees, or pi radians, is 0 again. The sine of 270 degrees, or 3/2 pi, is -1. The sine of 360 degrees, or 2
pi, is back to 0 again. Let's play with this sine wave a bit in JavaScript. Enter the following code into your
debugging console and test it:
for (var angle = 0; angle < Math.PI * 2; angle += 0.1) {
console.log(Math.sin(angle));
}
From here on out, you should get used to radians alone. Leave degrees behind, except when you actually
need them for rotation or some other purpose.
1
0
0
90
180
270
360
-1
Figure 3-18.
Values of sine