HTML and CSS Reference
In-Depth Information
angle = Math.random() * (Math.PI * 2),
x = canvas.width / 2 + Math.cos(angle) * radius,
y = canvas.height / 2 + Math.sin(angle) * radius;
context.fillStyle = "#000000";
context.beginPath();
context.arc(x, y, 2, 0, (Math.PI * 2), true);
context.closePath();
context.fill();
}
};
</script>
</body>
</html>
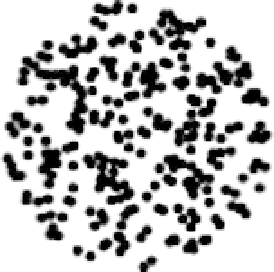
By taking the square root of the random number—it has a bias toward 1 and away from 0—we can smooth
out the distribution. You can see the result in Figure 19-6.
Figure 19-6.
A smoother circular distribution
Biased distribution
You might want to give the random dots free range over the entire canvas, but have them tend to show up
in the middle area. There would be some out on the edges, but the closer to the center you got, the more
there are. This is somewhat like the first circular example, but applied to a rectangular area.
You do this by generating multiple random numbers for each position, and then averaging them to get the
final value. For example, if the canvas element is 400 pixels wide, and you generate an x position for each
object with just one random number, then each object has an equal chance of being anywhere in that
range. But if you generate two random numbers from 0 to 400 and take the average, there's a bit higher
chance that it will be somewhere in the middle rather than out toward the edges.
Let's look at that in a little more depth. There is some chance that both numbers might be in a high range,
say from 300 to 400. There's about the same chance that both might be in a low range, from 0 to 100. But
there's a higher chance that one will be high and one low, or one middle and one high or low, or even both
in the middle. All of these possibilities average out to place most dots a bit closer to the middle.
To see it in code, as usual, we start on one dimension. Here's the example
07-random-5.html
: