HTML and CSS Reference
In-Depth Information
Debugging
One of the most important aspects of writing code is debugging it. Back in the old days of web
development, this usually meant throwing pop-up alert windows. Thankfully, web browsers now offer
increasingly sophisticated debugging tools for code introspection and performance analysis. These tools
enable you to step through a running application and interact with it, so you know exactly what's going on
in your code at a given time.
It's a safe bet that every modern, HTML5-capable browser has some built-in developer tools and a console
to input JavaScript statements and print out the results. You might have to dig around the menus of the
application, but they're in there somewhere.
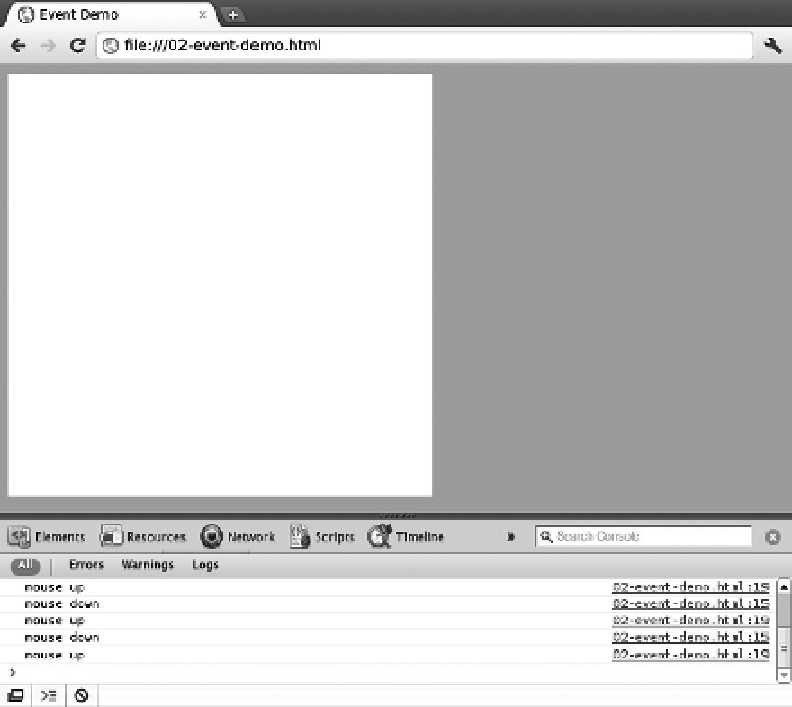
For example, in the Chromium web browser, click the wrench icon near the upper right corner, scroll down
to
Tools
, and then click
JavaScript Console
. This is where the logging messages print out. Figure 2-1
shows an open debugging session in Chromium. The Firefox web browser has something similar: In the
File menu, click
Tools
, and then click
Web Console
. Likewise, Internet Explorer 9 and Opera each has its
own developer environments. It's important you get comfortable with these tools in all the major browsers
because to maintain cross-browser compatibility, you debug in all of them. If you're having trouble finding a
particular browser's web development tools, be sure to check its help section.
Figure 2-1.
The Chromium browser debugging console