Java Reference
In-Depth Information
</xySeries>
</xyDataset>
<linePlot>
<plot/>
</linePlot>
</xyLineChart>
<!-- End XY Line Chart -->
</band>
</summary>
</jasperReport>
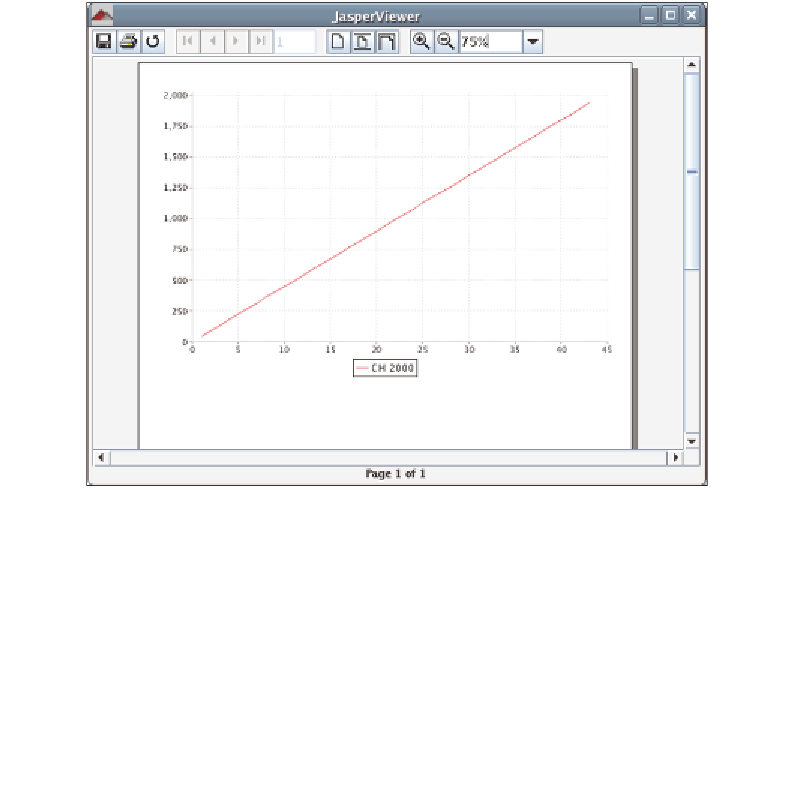
The generated report would look like this:
As we can see in the example for XY line chart, the
<dataset>
element must be
inside an
<xyDataset>
element. This element has no attributes. In addition to the
<dataset>
element,
<xyDataset>
may contain one or more
<xySeries>
element.
<xySeries>
may contain a
<seriesExpression>
element, which is used to
generate the label at the bottom of the chart in this example. It may also contain an
<xValueExpression>
element and a
<yValueExpression>
element. The last two
elements contain report expressions for the X and Y values in the chart, respectively.