Hardware Reference
In-Depth Information
80
4
2
75
0
70
- 2
65
Left
Center
Right
- 4
60
- 6
30
35
40
45
50
55
60
65
70
30
35
40
45
50
55
60
65
70
a
b
Time [seconds]
Time [seconds]
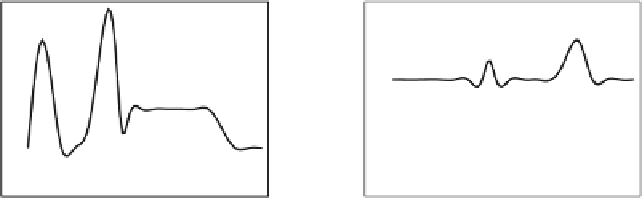
Fig. 9.8
System power profile and QoS penalty for the three MPEG4 instances.
a
Power,
b
QoS
Penalty
During the simulations, the RRM routine (executed on StrongARM running at
206 MHz) for the operating point selection always found a solution within a com-
putation time of 1 ms. This run-time overhead is enough small to be considered
negligible in the given context.
To further clarify the advantage given by the availability of different parallelized
versions of the same application, Fig.
9.9
shows a
bubble plot
representing the oper-
ating configurations effectively used by the RRM within the proposed urban scenario.
A bubble plot is a way of representing the relationship between three or four variables
on a scatter-plot. Observations on two variables are plotted in the usual way on the
x
and
y
axis using circles as symbols. The radii of the circles are made proportional
to the associated values for the third variable while different gray levels are used to
represent the fourth variable. In our specific case, the average operating frequency
and the power consumption of the operating configurations are respectively reported
on the
x
and
y
axis; frame rate supported from the configurations is proportional to
the circles dimensions while the gray level represents the amount of ADRES cores
needed to execute the configuration.
It is worth to note that among the configurations loaded by the RRM, only one
uses the sequential version of the MPEG4 encoder (i.e., the version running on one
Fig. 9.9
Bubble plot of
operating points loaded by the
Run-time Resource
Management


Search WWH ::

Custom Search