Hardware Reference
In-Depth Information
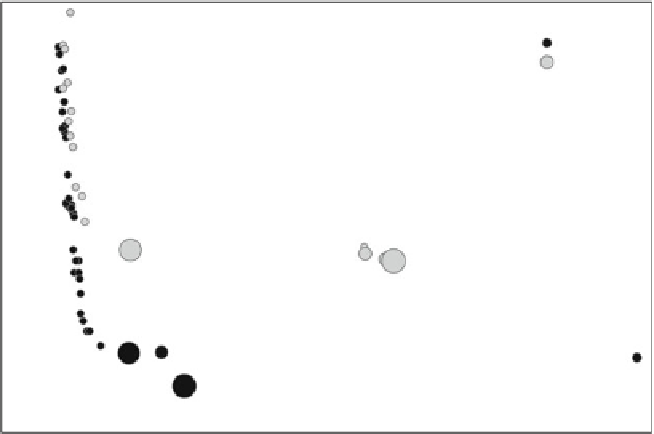
0.80
Power Dissipation (bubble size)
Pareto front MFGA
Original Pareto front
0.70
0.60
0.50
0.40
0.30
0.20
0.10
0.00
0.00
0.05
0.10
0.15
0.20
0.25
0.30
0.35
0.40
0.45
0.50
Area (normalized)
Fig. 8.4
A comparison between the Pareto front obtained with the automatic optimization and the
semi-automatic process based on statistical analysis
Table 8.3
Enhancement on Area and Total cycle metrics when compared with the statistically-
based approach grouping designs by Power dissipation
Power dissipation
Area
Total cycle %
Low power dissipation
Comparable
−
7.71
Medium power dissipation
−
17.35%
−
18.42
High power dissipation
Comparable
−
28.99
study, which allows to identify relations between parameters and metrics. There
are many tools that can be used, however, the Self Organizing Map (SOM) [
3
]is
particularly well suited for high dimensional spaces. Its main advantage compared
with other methods is that it allows to identify not only the global correlations between
the variables, but also highlights information about local correlations.The SOM is
a 2D map where the parameters and metrics are automatically mapped during the
learning process. Figure
8.5
shows the SOM obtained after the optimization process
described in the previous section.
Variables (parameters and metrics) that are correlated are mapped to nearby areas
of the map. The spatial location of the variables total energy (total_energy), power
dissipation (power_dissipation) and data cache size (dcache_size), which are all
mapped in the lower-right corner of the map, allows to conclude that there is a strong
correlation between them. There is also a large correlation between the occupation
area (area) and the secondary cache size (scache_size), and between total cycle
(total_cycle) and store queue size (sq_size).


Search WWH ::

Custom Search