Hardware Reference
In-Depth Information
Processing power
Mobile
Life-critical
Multimedia
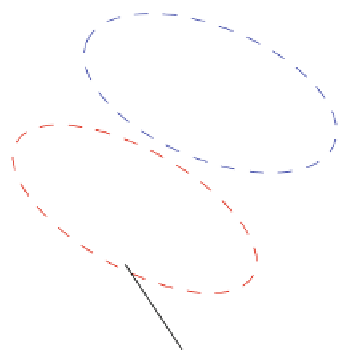
Fig. 6.1
Different applications scenarios are converging to the same SoC design paradigm
2,000
1,800
50
1435
45
General Purpose
Core Host
1,600
40
1,400
35
30
1023
1,200
878
25
1,000
y
669
20
800
526
424
15
600
400
348
268
10
5
212
161
126
101
200
79
58
44
32
2007
2008
2009
2010
2011
2012
2013
2014
2015
2016
2017
2018
2019
2020
2021
2022
Number of Processing Engines
Total Logic Size
(Normalized to 2007,Left Y Axis)
Total Memory Size
(Normalized to 2007, Left Y Axis)
(Right Y Axis)
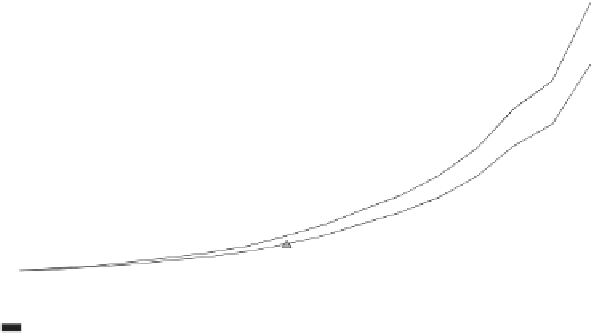
Fig. 6.2
Increasing computing power density brings to ever more complex architectures with an
increasing count of per-chip functionality and resulting in more complex applications. The chart
represents the Processing Elements (PE) density per technology year [
8
]


Search WWH ::

Custom Search