Biomedical Engineering Reference
In-Depth Information
TCC
20
15
10
4 pA
5
TXA
0
-5
53.61
53.62
53.63
53.64
Time (s)
2 pA
0.1 s
(a)
(b)
Gramicidin A
Points
10
4
10
3
1
0
2
10
1
10
0
0.04
0.02
3 pA
0.00
Alamethicin
3
2
1
200 pA
0
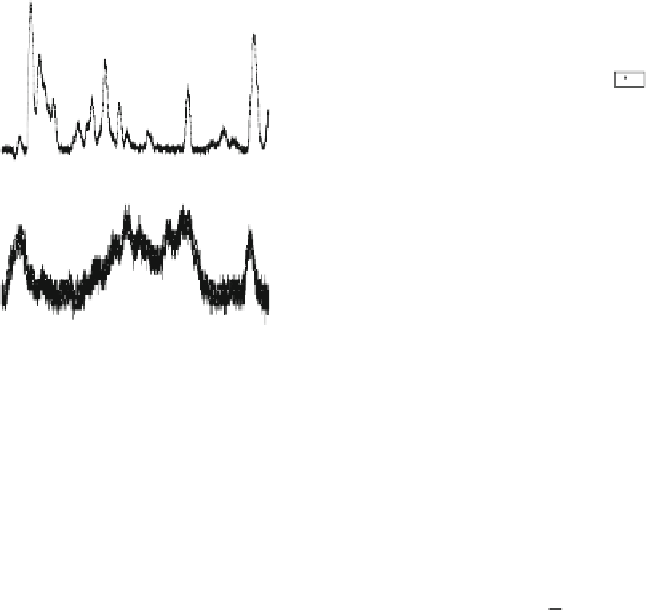
Fig. 4.7
Electrical conductance states that determine the membrane's transport properties induced
by ion channels. The
upper panel
shows triangular-shape conductance events induced by thio-
colchicoside (TCC) and taxol (TXL), both at 90
100 mV.) Both traces were
filtered at 20 kHz, but the
lower
one shows higher noise due to its presentation (current axis) at
an amplified scale. In a high-resolution plot (shown in the
right side
of the
arrow
)ofasingle
event showing individual points (in Origin 8.5 plot) we observe all points (
open circle
) with val-
ues of conductance increasing and decreasing, respectively, at both
left
-and
right
-lateral sides
of the chemotherapy drug-induced triangular conductance events. The
lower panel
(
a
) illustrates
rectangular-shape conductance events in gramicidin A (gA) and alamethicin (Alm) channels [
9
].
gA channel activity was recorded at 200 mV and Alm at 150 mV. Traces representing gA and Alm
channel activities in phospholipid bilayers were recorded at filter frequencies 2 and 20 kHz, respec-
tively. A lower filter frequency for traces representing gA channel activity is acceptable because
of the channel's relatively higher stability. In panel (
b
) the point count plots of the current traces
through gA and Alm channels peak at discrete values of conductance
µ
M. (pH
=
5
.
7
,
V
=


Search WWH ::

Custom Search