Biomedical Engineering Reference
In-Depth Information
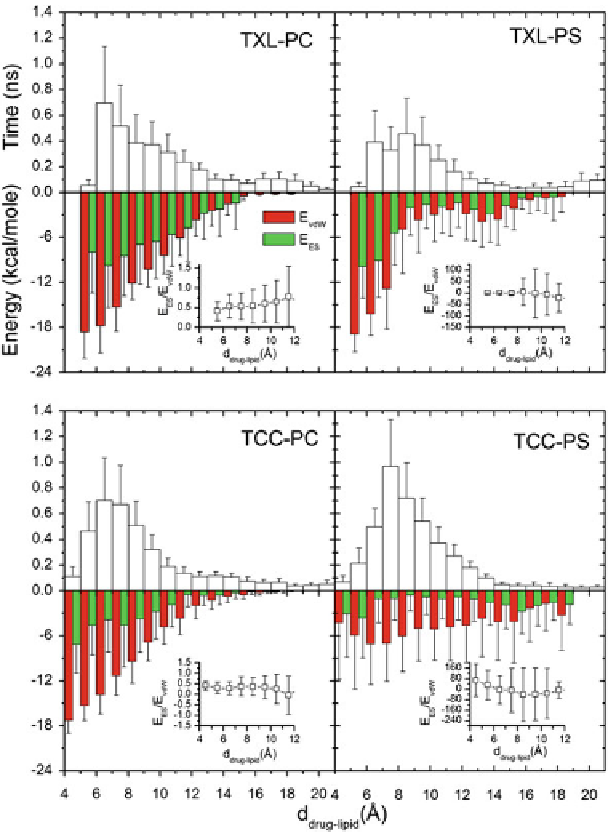
Fig. 5.26
In all the histograms (
upper panel
)oftimeversus
d
drug
−
lipid
, the duration of the drug/lipid
complex staying together (height) within a distance (width) in 6 ns MD simulations is presented.
Lower panels
show the histograms of non-bonded van der Waals (vdW) energy (
E
vdW
) and elec-
trostatic (ES) interaction energy (
E
ES
). To avoid color conflict,
E
vdW
and
E
ES
are shown to occupy
half-half widths although each half represents the whole width of the corresponding histogram
The calculations using screened Coulomb interactions demonstrate that the bilayer
deformation energy (
G
def
) increases by orders of magnitude with the
increase of the order of the lipid screening. The increasing lipid screening order
is a measure of the hydrophobic bilayer thickness channel length mismatch, due
to either an increase in bilayer thickness or decrease in channel length, or both.
G
I
,
II
≈
Search WWH ::

Custom Search