Biomedical Engineering Reference
In-Depth Information
0.325
0.33
0.335
10
150000
10
150000
I
10
100000
10
100000
I
10
50000
50000
10
II
10
0
10
0
0.325
0.33
0.335
r
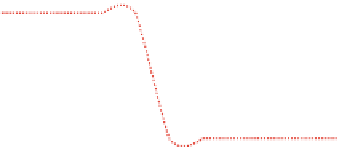
Fig. 5.17
A plot of the energy as a function of the reaction coordinate for Alm channels in
lipid bilayer energetics at different order of screening (single- and double-dashed curves are for
the first- and second-order screening, respectively). Here and in Fig.
5.18
,
q
L
/
q
Alm
=
0
.
005,
(1
/
0
)
q
L
q
Alm
≈
1 has been chosen (for simplicity), and
r
LL
=
7
.
74597 Å
consequently
G
I
,
II
(see Fig.
5.20
). We observe about three times higher values
of both
G
I
and
G
II
for both the first- and second-order of lipid screening for an
Alm channel with three monomers in the 'barrel-stave' pore, compared to a gA
channel as shown in Fig.
5.19
. Quantitatively similar (3-fold increases) higher values
of
G
I
,
II
(see Fig.
5.20
) are observed for both lipid screening orders for an Alm
channel, compared to those for a gA channel. The three-times higher values of
G
I
,
G
II
, and
G
I
,
II
in the Alm channel with three monomers are obvious, because
in this specific Alm channel conformation there are six channel bilayer interaction
sites, while a gA channel always has only two interaction sites with the bilayer (see
Figs.
5.2
and
5.8
). It seems that the interaction energy between monomers in both gA
and Alm channels becomes irrelevant in comparison to the binding energy between
the channel and the bilayer. We also observe that
G
I
,
G
II
and
G
I
,
II
increase with
the increase of lipid peptide charge ratio following:
q
L
q
M
3
G
I
,
G
I
,
G
I
,
II
∝
,
(5.29)
where
s
2, etc. for the first-, second-, etc. order lipid screening, respectively, for
both gA and Alm channels. Here,
q
M
stands for gA (
q
gA
)orAlm(
q
Alm
) monomer
charges.
In Fig.
5.21
we observe a modest and linearly proportional effect of the lipid
dimension
r
LL
on
=
1
,
G
I
,
II
, for both the first- and second-order lipid screening with
three-times higher effects for Alm channels than for gA channels. Figure
5.22
shows
that, for both gA and Alm channels, the reaction coordinate at which we have shown


Search WWH ::

Custom Search