Image Processing Reference
In-Depth Information
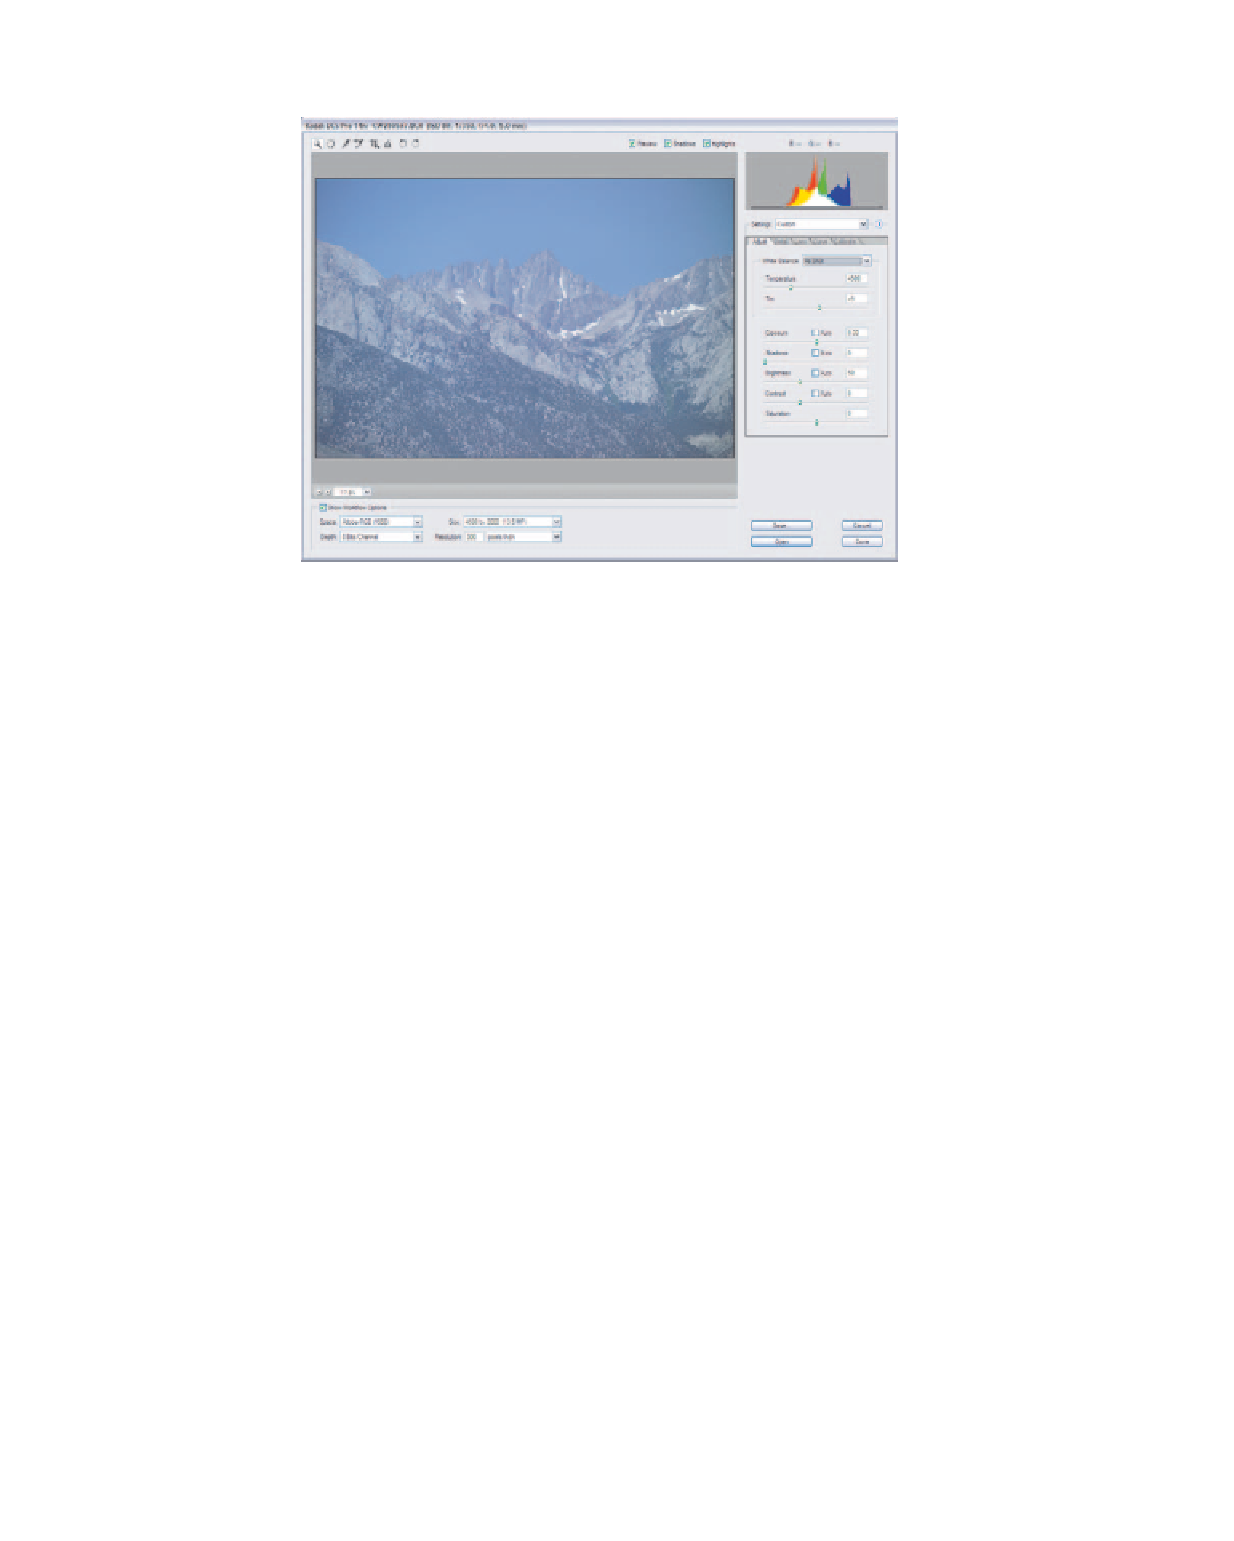
Figure 2.18
When all of the image information is bunched together in the histogram, the image will
look flat with no true shadow or highlight detail. This is easy to correct with the adjustment sliders.
38
Another problematic area for your image can appear when all of the data in the
histogram is bunched together with empty space between the edges of the histogram
and the start of your image information, as shown in Figure 2.18. This type of his-
togram can indicate a flat, low contrast image that is lacking true shadows and high-
lights. Luckily, this is also the easiest problem to correct. All of the image information
is there and usable. It's up to you to bring out that detail through adjustments to expo-
sure, shadows, highlights, and contrast.
The histogram is one of the most valuable tools at your disposal when you are
making adjustments to the image. By monitoring the effect of changes to exposure,
shadows, highlights, and contrast, you can maximize the tonal range of your image
while preventing detail from being lost through adjustments that are too aggressive. In
the next section, I'll show you how to use both the histogram and the Shadows and
Highlights warnings to get the most from your RAW file prior to conversion.
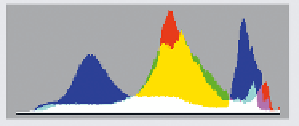
The histogram displays red, green, and blue values individually. In addition to
these colors, you'll see cyan, magenta, yellow, and white displayed in the histogram (Fig-
ure 2.19). These colors show where there is overlap between the different color channels:
•
Cyan
indicates pixels where both blue and green are present.
•
Magenta
represents the overlap between red and blue.
•
Yellow
shows pixels that contain both red and green.
•
White
indicates pixels that have data from all three color channels.
Figure 2.19
The Histogram display shows each color
channel and the number of pixels that con-
tain data for multiple color channels.
Search WWH ::

Custom Search