Information Technology Reference
In-Depth Information
maximum displacement will also change. As the basilar membrane is continuous, the position of maximum
displacement is infinitely variable allowing extremely good pitch discrimination of about one twelfth of a semitone
which is determined by the spacing of hair cells.
Figure 4.13:
The basilar membrane symbolically uncolled. (a) Single frequency causes the vibration envelope
shown. (b) Changing the frequency moves the peak of the envelope.
In the presence of a complex spectrum, the finite width of the vibration envelope means that the ear fails to register
energy in some bands when there is more energy in a nearby band. Within those areas, other frequencies are
mechanically excluded because their amplitude is insufficient to dominate the local vibration of the membrane.
Thus the
Q
factor of the membrane is responsible for the degree of auditory masking, defined as the decreased
audibility of one sound in the presence of another.
4.8 Critical bands
The term used in psychoacoustics to describe the finite width of the vibration envelope is
critical bandwidth
. Critical
bands were first described by Fletcher.
[
7
]
The envelope of basilar vibration is a complicated function. It is clear from
the mechanism that the area of the membrane involved will increase as the sound level rises.
Figure 4.14
shows
the bandwidth as a function of level.
Figure 4.14:
The critical bandwidth changes with SPL.
As was shown in
Chapter 3
, the Heisenberg inequality teaches that the higher the frequency resolution of a
transform, the worse the time accuracy. As the basilar membrane has finite frequency resolution measured in the
width of a critical band, it follows that it must have finite time resolution. This also follows from the fact that the
membrane is resonant, taking time to start and stop vibrating in response to a stimulus. There are many examples
of this.
Figure 4.15
shows the impulse response.
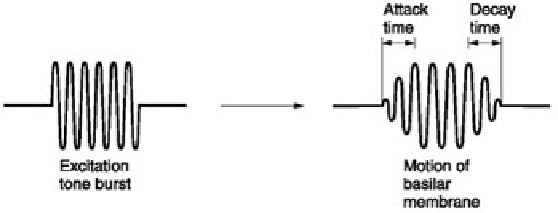
Figure 4.15:
Impulse response of the ear showing slow attack and decay due to resonant behaviour.
Figure 4.16
shows the perceived loudness of a tone burst increases with duration up to about 200 ms due to the
finite response time.