Geography Reference
In-Depth Information
Presentation
Sensemaking loop
Hypothesis
Schema
Foraging loop
Evidence
file
Shoebox
External
Data sources
Effort
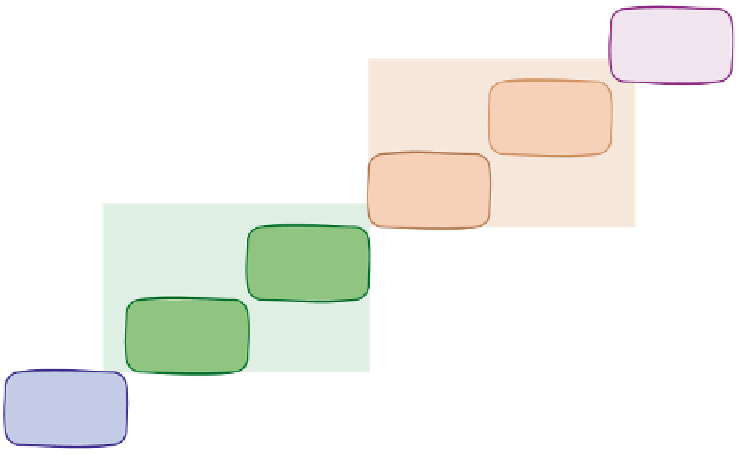
Figure 3.1
Sense-making schema model by Pirolli and Card (2005). Where the data is processed,
the user visualizes the information and confirms relationships with the data and then presents their
conclusions to the client
and encoding data in that representation to answer task-specific questions'. One of the
most comprehensive sense-making models is by Pirolli and Card (2005), Figure 3.1. In
their schema model the analyst searches and filters the data for relevant information, which
provides a demonstration set that is stored for future reference (known as a
shoebox
). Specific
and relevant information or inferences may then be extracted and stored to provide evidence
files. Then the data is structured, organized and represented in a schematic way. This is both
to highlight interesting facts and to confirm relationships within the data; it matches with
the first and second stages of DiBiase's model. This organizational part of the process may
be achieved through the representation of the data by an informal diagram or a complex
visualization. Then the case is built, and finally presented to the client. This is a process-
oriented model, where a developer can clearly map the stages into processes of an exploratory
visualization tool.
Exploration itself is a process that tends to generate many possibilities and widens the
search space. Techniques of generating multiple views, selecting and highlighting elements,
zooming and displaying additional detail all help the user to explore. However, the user still
needs to draw conclusions and present that information to colleagues. Thus, for exploration
tools to be successful, developers need to provide methods to both widen and narrow
the solution space, support the user through an exploration and support them in their
presentation of that learned information.
Therefore, exploratory environments require a wide range of features: (1) tools that
perform effective
data preparation
; (2) informative
visualization techniques
that display
the information comprehensively and clearly and that display the information in different
forms; (3)
interaction
techniques that allow the user to manipulate the information; and
(4) extensible and easy-to-use
tools and toolkits
. These four parts are extremely important


Search WWH ::

Custom Search