Geography Reference
In-Depth Information
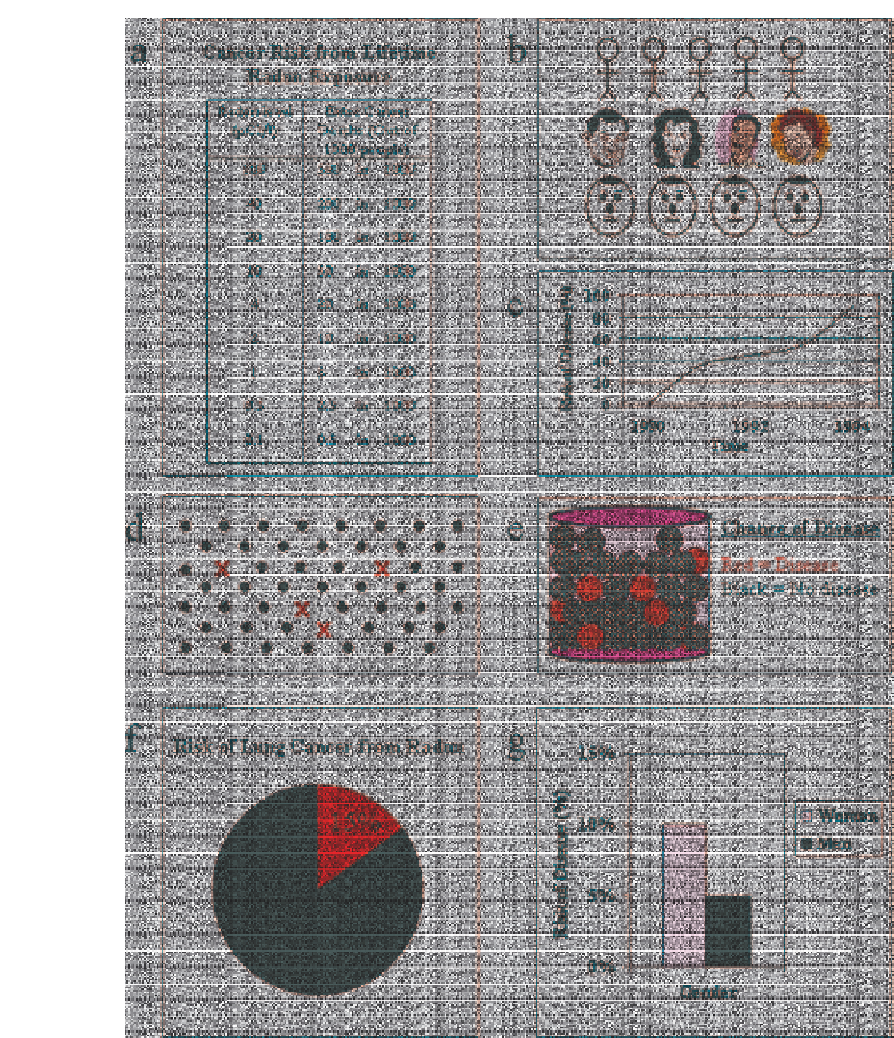
Figure 14.2
Examples of visual representations used to communicate risk. The representations
include the following: (a) risk ladder; (b) Chernoff faces; (c) line graph; (d) graph with dots and Xs,
with each X representing an area or item affected by a hazard; (e) marbles; (f) pie charts; and (g)
histograms (source: reprinted from Lipkus and Hollands, 1999,
National Cancer Institute Monographs
,
25
:149-163 with permission from the author)


Search WWH ::

Custom Search