Geography Reference
In-Depth Information
300
250
200
150
100
50
0
Bar Chart
250
One date
200
150
Two+ dates
100
Time Series
600
How many
dates
covered?
500
400
300
200
100
0
Bar Chart
400
350
One date
300
250
200
150
100
One category
50
Yes
0
How many
dates
covered?
Stacked Chart
Two+
Is nCube
additive?
100
No
80
60
Two+
40
20
0
How many
categories
in variable?
Multiple Time Ser.
No graph
currently
possible
Yes
-10
-8
-6
-4
-2
0
2
4
6
8
10
Pyramid
Does one
var. have only
2 categories?
No
Yes
1D nCube
One
date
0
50
100
150
200
Stacked Bar
Does either
variable have
more than 50
categories?
Does one
var. have only
2 categories?
How many
dates
covered?
Yes
Two+
No
-10
-8
-6
-4
-2
0
2
4
6
8
10
2D
nCube
How many
variables
in nCube?
Pyramid x Dates
No
3D nCube
0
Stacked Bar x Dates
50
100
150
200
Create multiple graphs, one for each
category of the variable with fewest
categories, using same graph types
as for two dimesnional nCubes
4D+ nCube
No graph
currently
possible
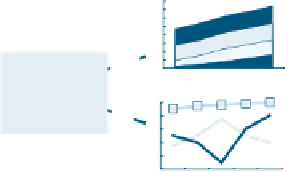
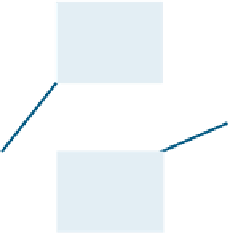
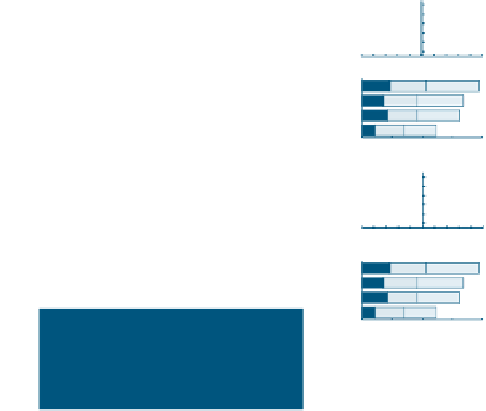
Figure 13.6
A Vision of Britain through Time
: decision tree for graphing nCubes
Firstly, the current system maps only
rates
, but facilities to explore
nCubes
through maps
are highly desirable. The problem here is partly one of providing a comprehensible user
interface given the range of possibilities with higher dimension nCubes. Mapping one-
dimensional nCubes is simple: a choropleth map showing any one of the categories within
the single variable as a percentage of the universe, i.e. the overall total. With two-dimensional


Search WWH ::

Custom Search