Geography Reference
In-Depth Information
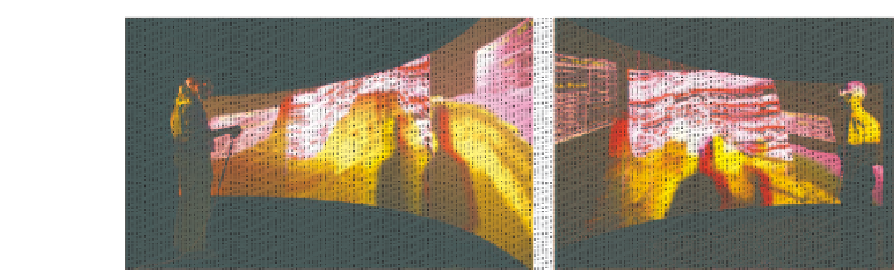
Figure 11.10
Earth scientists using Schlumberger's Inside Reality; Virtual Geological Exploration
software. The data shown is the geological subsurface areas found in a region of the North Sea
(software from Schlumberger 2007) courtesy of Schlumberger Ltd.
set and also the ability to interactively cut away layers of ultrasound data or reveal different
intensity levels of the rock. This is an important mode of interactive visualization, involving
just a single individual exploring a data set in order to discover for themselves new insights.
It is postulated, although far from proved, that filling the user's visual senses with data aids
the process of discovery. Later in 2003, one of the authors, while working at De Montfort
University, Leicester, UK, specified and built a similar visualization centre. More modern
components were used, which decreased the cost, and a generally more frugal reconstruction
brought the overall price to just under £250 000. Reducing the cost had the effect of extending
the user base from architects to product designers. It is seen that using curved screens at high
resolutions allows a visualization to cover both the focus and periphery of the user's field
of view (so-called semi-immersion). More extensive environments have been constructed
that allow for full immersion, including the ReaCTor or CAVE
TM
. These consist of a cubic
display system often with four active stereo screens, three walls and the floor, although it is
also possible to project onto all six sides of a cube. This increases the cost and some users
who have experienced this type of system refer to it as a pre-cursor of the Holodeck from
Star Trek. The authors have worked in many systems and links to resources are available
through the UK visualization support network (vizNET, 2007).
In 2004 the authors oversaw the construction of the first Access Grid node, the next gen-
eration of video conferencing system (Access Grid, 2007), which was equipped with passive
stereoscopic visualization projection equipment, and cost only £80 000. This enabled stereo-
scopic visualization to augment or take over a normal remote video conferencing meeting.
It should be noted that this new video conferencing system also embraces the idea of us-
ing large screens offering high resolution, creating semi-immersive presentations. Figures
11.11-11.13 show visualizations presented to a research audience within this node. The first,
Figure 11.11, shows a representation of geological borehole samples, positioned in their cor-
rect three-dimensional geographic location, but abstracted with a pseudo-colour histogram
of the elements superimposed along the borehole length. The audience can interactively ex-
plore the three-dimensional space and understand spatial locations; for example detecting
areas where specific heavy metals exist (GeoExpress software product range from Oxford
Visual Geosciences Ltd, 2007). Figure 11.12 presents Google Earth stereoscopically projected
onto part of the screen describing a virtual mapping tour through a three-dimensional


Search WWH ::

Custom Search