Geography Reference
In-Depth Information
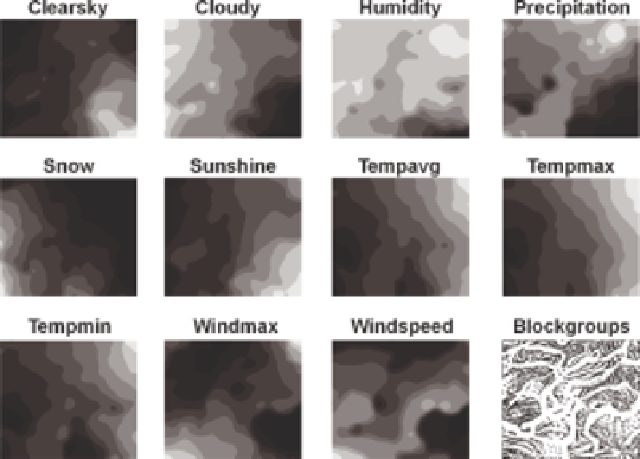
Figure 8.6
Component planes of a high-resolution SOM of 250 000 neurons constructed from
climate data for 200 000
+
census block groups. Block groups mapped onto SOM (bottom right)
which such SOM can then become the basis for discovery of patterns and relationships that
are simultaneously 'valid, novel, potentially useful, and ultimately understandable' (Fayyad
et al.
, 1996). The
Shapefiles
generated from
SOM PAK
code book files can be visualized in
an uncomplicated manner in standard GIS software, as shown in Figure 8.6. Each of the 11
component planes is simply shown through greyscale shading of all 250 000 neurons (lighter
shading indicates higher weight for an attribute). Side-by-side display allows relationships
between variables to be observed. For example, in the upper-right corner of the SOM one
observes high values for humidity, precipitation and temperature, but low amounts of snow-
fall, and a medium number of days with sunshine. Equally straightforward as the display
of component planes is the point symbol display of all 200 000
+
block groups (lower-right
corner of Figure 8.6).
That point display is an example of the suggestive power of visualization and the danger
inherent in it. Notice how the apparent arrangement of densely occupied and empty por-
tions in the spatialization suggests the existence of linear separation regions in attribute
space, which separate 'clusters' from each other. While one might find aesthetic value
and even beauty in this display of 'data mangroves', they in fact turn out to be largely
artefacts caused by data preprocessing. Some in-depth explanation of this issue is in order,
less for what it may teach us about SOM, but more as an example of how visualization has
the power to not only deceive us, but also enable us to uncover and explain those deceptions.
Compare the block group display with each of the component planes and try to find
some correspondence, which might indicate that the corresponding variable possibly had
an overriding influence on SOM training! It would appear that patterns in block group
point locations are most closely related to patterns in the average wind speed variable. In
that component plane one observes sudden changes in wind speed, with some wind speed


Search WWH ::

Custom Search