HTML and CSS Reference
In-Depth Information
7. Document your code using descriptive comments. Close the file, saving your
changes, and then return to the
clist.htm
file in your text editor.
8. Add a
script
element to link to the
tables.js
file you created.
9. Scroll down to the figure box for the contribution totals. Within the figure box, insert
a
script
element that runs the showSummary() function.
10. Scroll down to the figure box for the contributors data list. Within the figure box,
insert a
script
element that runs the showTable() function.
11. Save your changes to the file, and then open
clist.htm
in your Web browser. Verify
that the summary and contributor list tables appear as shown in Figure 12-36.
12. Submit your completed files to your instructor, in either printed or electronic form,
as requested.
Case Problem 2
Use arrays, loops,
and conditional
statements
to create a
horizontal
bar chart.
Data Files needed for this case Problem: back.jpg, bartxt.js, electtxt.htm, logo.jpg,
modernizr-1.5.js, results.css, votes.js
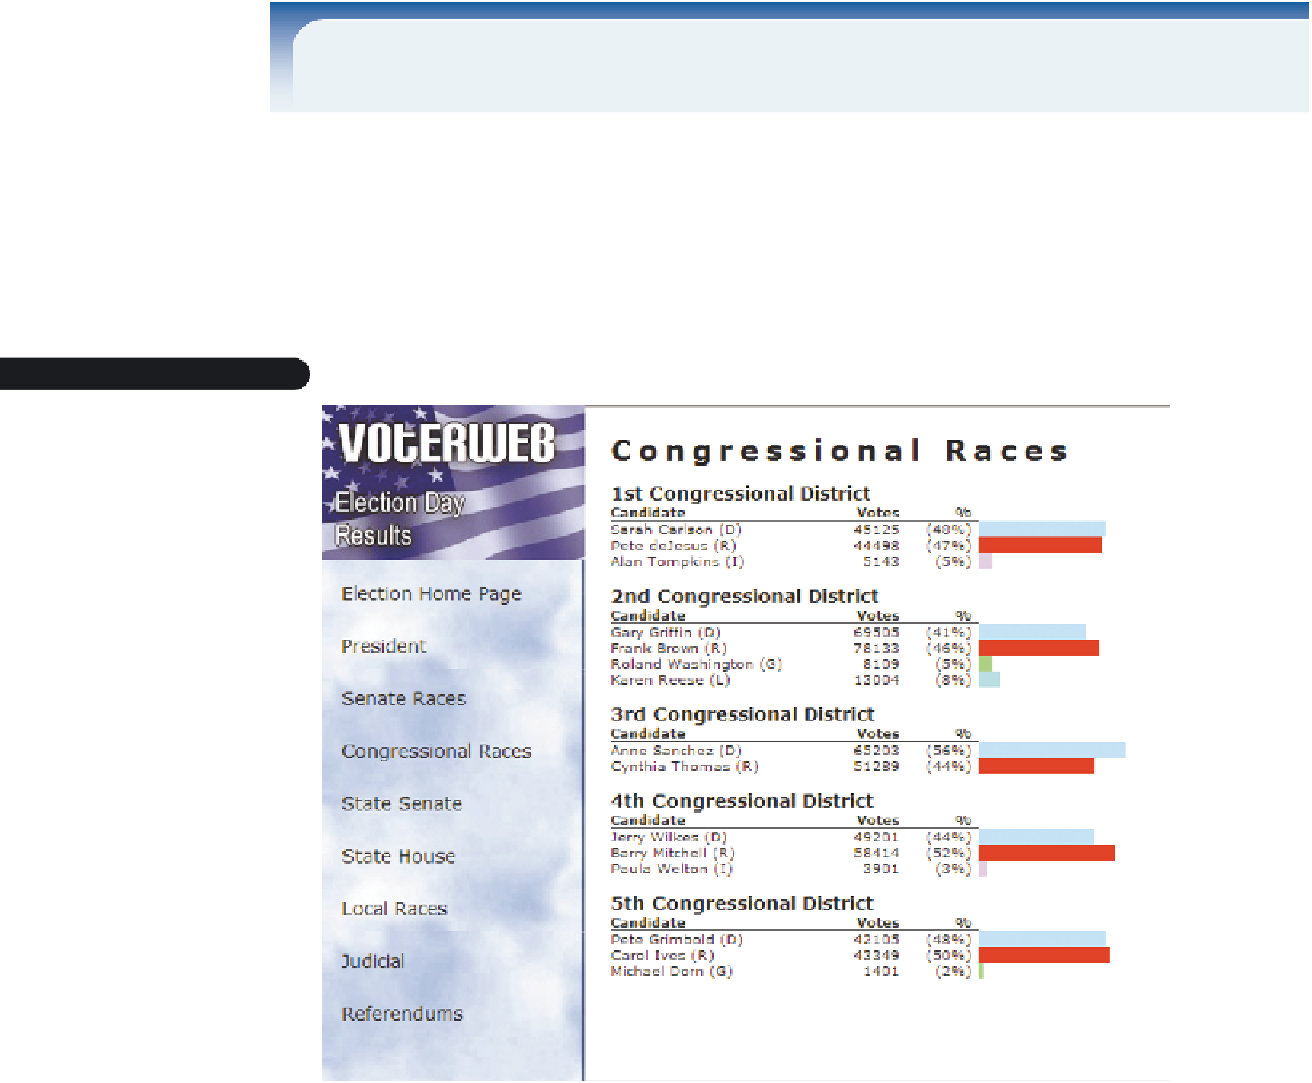
VoterWeb
VoterWeb is an online source for election news and results from national,
state, and local races. Faye Summerall is one manager of the Web site development
team. Faye wants to add horizontal bar charts to the Web pages displaying election
results. The length of each bar should correspond to the percentage of votes that a can-
didate receives in a given race. She has asked you to develop a JavaScript program that
automatically writes the bar chart. Figure 12-37 shows a preview of the Web page for a
series of Congressional races.
Figure 12-37
bar charts on voterweb