Database Reference
In-Depth Information
•
First, instead of showing the available bandwidth and link rate of each timeslot, in the overall
agenda model each timeslot contains a list of the available bandwidth and link rate of all the
routers. The list is sorted according to the available bandwidth under the current link rate.
•
Second, instead of indicating the available bandwidth of the pipeline under the current link
rate, the dark bar in each timeslot indicates the available bandwidth of the link. It is the
minimum available bandwidth of all the routers on the link at the time.
•
Third, instead of indicating a shutdown period of the router at either side of the pipeline, the
shutdown period in the overall agenda model (i.e., between
t
2
and
t
3
) indicates a shutdown
period of the link. This means that at least one of the routers on the link is shut down.
For creating the overall agenda of a link, all the pipeline agendas on the link need
to be collected. We apply an agenda collection approach
[74]
. According to this ap-
proach, all the pipeline agendas are finally transferred to the
target
of the link. There-
fore, the agenda merge algorithm is conducted at this node.
The overall agenda consists of a sorted event list
L
for describing timeslots and a
two-dimensional data structure
Ranking
for recording the status of each router at each
timeslot.
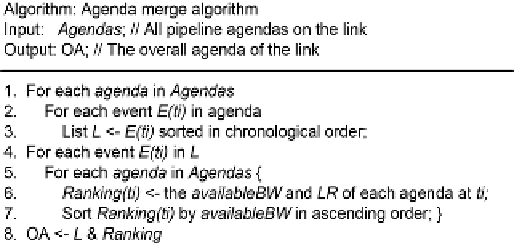
Figure 7.5
shows the pseudo code of the pipeline agenda merge algorithm.
First (lines 1-3), all events from all pipeline agendas are sorted in
L
in chronologi-
cal order. Then (lines 4-6), grouped by events, the available bandwidth and link rate
of each router is stored in
Ranking,
which represents the status of each router in the
timeslot. In addition (line 7), for each event, all the routers on the link are sorted by
the available bandwidths under current link rates in ascending order. The complexity
of the agenda merge algorithm is
O
(
n
2
m
log
n
) where
n
is the total number of events
(or timeslots) and
m
is the number of pipelines (or routers) on the link.
7.3
Energy consumption model for Cloud data transfer
To investigate the energy consumption of Cloud data transfer, a deep understanding of
how the energy is consumed in Cloud network devices is required. In this section, we
adopt an end-to-end energy consumption model called Energy Consumption Model
for End-to-End Networks (ECOFEN) that was proposed to support our research.
Details of the ECOFEN model can be found in the original literature
[74]
.
Figure 7.5 Agenda merge algorithm
Search WWH ::

Custom Search