Database Reference
In-Depth Information
still applicable for calculating the reliability of a single replica when the disk failure
rate is a constant.
4.2.2 Data reliability with variable disk failure rate
From the previous discussion, it can be seen that exponential distribution is able to
describe data reliability when disk failure rate is a constant. However, as mentioned
in
Section 2.1
, the failure rates of disks in reality vary from time to time. In practice,
quality control is conducted for each batch of disks before they leave the factory.
Hence we consider the failure pattern of a batch of disks is known. As one of the same
batch of disks, the actual failure pattern of the disk should adhere to the batch failure
rate pattern quite well. Hence we assume that each disk's failure rate pattern is known.
Here we investigate the data reliability with a variable disk failure rate.
To calculate the data reliability with a variable disk failure rate, based on the dis-
cussion earlier, we first assume that when the disk failure rate is a constant, data reli-
ability follows exponential distribution, that is, equation
(4.1)
holds. Second, when the
disk failure rate is a variable, by using the discrete disk failure rate pattern, we assume
the disk failure rate pattern contains several life stages of disks. In each life stage of a
disk, the disk failure rate does not change.
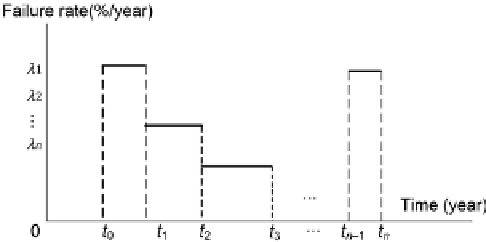
Assume that replica
r
is stored in disk
D
between
t
0
and
t
n
, in this period of time,
the disk failure rate pattern of disk
D
contains
n
life stages, in which the disk failure
rates are
λλ λ
,
,...,
respectively where
λ
i
indicates the disk failure rate between
12
n
time
t
i
1
and
t
i
,
i N
.
Figure 4.1
shows the failure rate pattern of disk
D
between
time
t
0
and
t
n
.
We derive the data reliability of a single replica with a variable disk failure rate in
equation
(4.2)
:
−
(4.2)
RT e
()
=
−
λ
T
n
1 1
is the weighted mean of the disk failure rate with stor-
age durations as weights (“weighted average failure rate” for short), and
∑
n
where
∑∑
λ
=
λ
/
jj
T
T
j
j
=
j
=
n
T
=
T
j
j
=
1
Figure 4.1 Failure rate pattern of disk
D
between time
t
0
and
t
n


Search WWH ::

Custom Search