Biology Reference
In-Depth Information
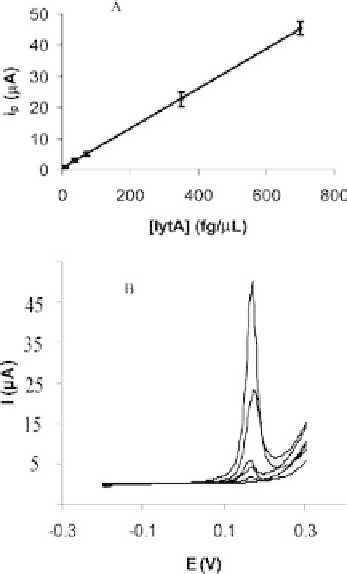
Figure 9.13.
(A) lytA genosensor responses for different concentrations
of complementary target. Data are given as average
±
SD (n
=
3). (B)
Cylic voltammograms corresponding to the background (700 fg/
μ
Lof
noncomplementary target) and to each concentration of complementary
targetofthelinearcalibrationcurve.ReproducedwithpermissionfromACS
[56].
analytical signal for the concentrations of complementary target
assayed is shown with error bars. It is composed between 4 and 10
in terms of percent RSD.
Also, comparing linear ranges obtained for target autolysin
throughbothmethodologies,thesensitivityoftheassayisimproved
by at least 1 order of magnitude.
Thus, this genosensor can detect 7 fg/
μ
L, approximately 14-
fold less than the concentration detected when the enzymatic
reaction was carried out only with 3-IP [54]. Also, the use of
3-IP as the enzymatic substrate allows a better control of the