Biology Reference
In-Depth Information
Max: -0.0195
Max: -0.022
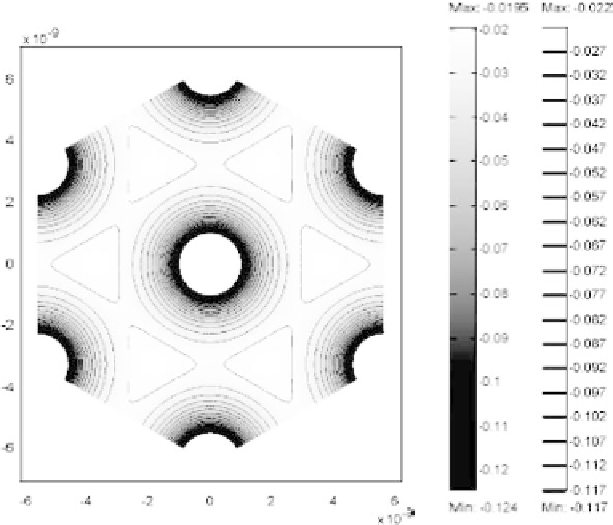
Surface: Electric potential Contour: Electric potential
-0.02
× 10
-9
-0.027
-0.032
-0.037
-0.042
-0.047
-0.052
-0.057
-0.062
-0.067
-0.072
-0.077
-0.082
-0.087
-0.092
-0.097
-0.102
-0.107
-0.112
-0.117
-0.03
6
-0.04
4
-0.05
2
-0.06
-0.07
0
-0.08
-2
-0.09
-0.1
-4
-0.11
-6
-0.12
-6
-4
-2
0
2
4
6
× 10
-9
Min: -0.117
Min: -0.124
Figure 6.9.
Simulated electric potential produced by DNA probe immo-
bilized with the mixed SAM structure with an uncharged spacer. The DNA
probedensityissettobe3
×
10
12
molecules/cm
2
andionicstrength50mM.
decreasingtheionicstrengthofthemeasurementsolutioncanresult
inalargerandmoreextendedpotentialfield,whichleadstoalarger
impedance signal.
The signal, defined as the ratio
R
ct
(duplex)/
R
ct
(probe), is
estimated to have very different ranges for the situation where DNA
orPNAareusedasprobes:withPNAthesignalincreasesdrastically
upon hybridization from 1.1 to 2
×
10
6
when the ionic strength is
reducedfrom1000to1mM;underthesameconditions,usingaDNA
probeonlyyieldsanincreasefrom1.05to3.5.Thesignalrangeusing
DNA probe saturates when the ionic strength is lower than 10 mM,
since
R
ct
ofbothssDNAanddsDNAincreaseswithsimilaramplitude.
For the PNA probe, as the probe itself is not charged, decrease of
ionic strength always gives increased signal range. When the ionic
strength is su
ciently low (
∼
50 mM for the probe density studied),