Geoscience Reference
In-Depth Information
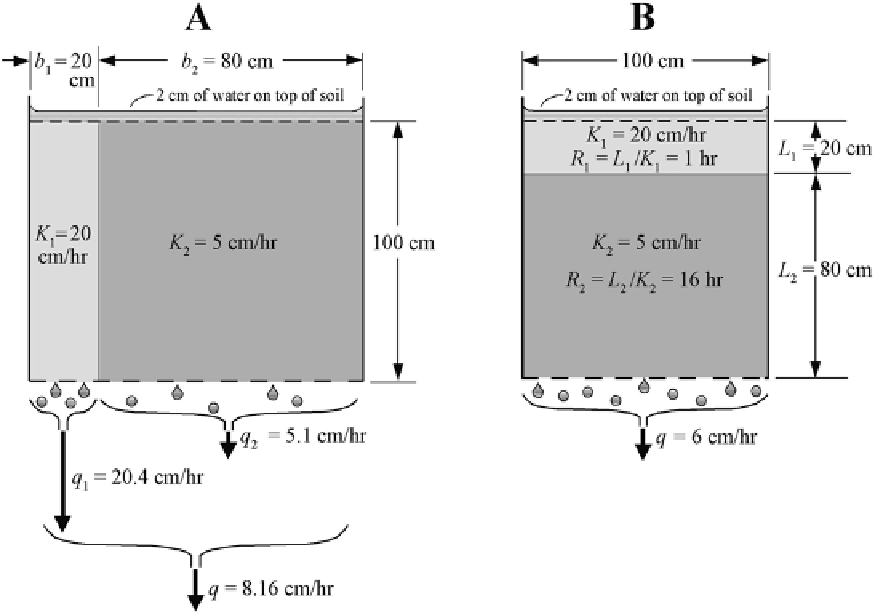
Fig. 9.5
A simple 2-layer example of the “theoretical drawing” of Fig.
9.4
. The top water level is exactly drawn in the graph (2 cm above the land surface),
the bottom water level at the outfl ow is here taken as identical with the bottom of the soil column. Hopefully, it is an easily visualized illustration of computing