Geoscience Reference
In-Depth Information
from molecules located below plane. Since the surface tension inside of the capillary
is smaller than that away from the tube in the horizontal fl at plane of water, water is
sucked into the tube until an equilibrium is reached. At equilibrium, the weight of
water sucked up into the capillary equals the difference of surface water tensions
between the curved and fl at plane water levels. The smaller the radius of the capil-
lary tube, the greater is the mentioned difference in surface water tensions and the
higher is the column of water inside of the capillary, provided that the contact angle
does not change, i.e., the hydrophilicity does not change.
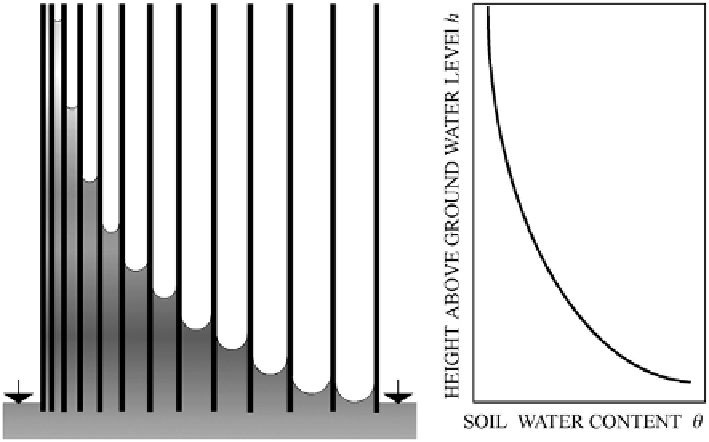
The simplest model of water in soil is composed of parallel vertical hydrophilic
capillary tubes with radii from the smallest tube on the left side increasing to the
largest on the right side of the model as shown in Fig.
8.7
. Owing to the hydrophilic-
ity of the capillaries, after inserting the bottom end of this model into free water, the
water level inside each tube rises to the height related to its particular radius. Hence,
the highest water meniscus occurs in the smallest tube on the left hand side, and as
the radii gradually increase, the water menisci gradually reach their lowest height
within the largest tube on the right side. Connecting each of the heights of their
menisci, we obtain a smooth curve. A similar curve is obtained when the heights
above the groundwater level are plotted against fi eld-measured soil water content
values of a silty or fi ne sandy soil.
Comparing this fi eld-measured curve with that illustrated in Fig.
8.7
derived
from the capillary model leads us to the conclusion that for some simple cases, the
behavior of soil water is successfully mimicked by the parallel capillary tube model.
The success of the model was judged on the basis of soil water content measurements
Fig. 8.7
On the
left
, a simplifi ed capillary model illustrates the soil water content above ground-
water level. On the
right
, after plotting measured data we obtain the smooth curve of water content
distribution above groundwater level