Hardware Reference
In-Depth Information
type: "GET",
});
This means that just before the data is read from the database to be plotted, we are calling
the Arduino board to get the temperature and humidity measurements.
Note
All the code for this section can be found inside the GitHub repository of this chapter at
We can now test this part of the chapter. Note that the code from the GitHub repository in-
cludes an example database so you can test the project right away, but I recommend delet-
ing the file just before testing the project, so you will plot your own measured data while
testing the code.
You can just put all the code for the plotting part inside a folder at the root of your web
server. Then, open the
plot.html
file via the localhost URL in your web server. You
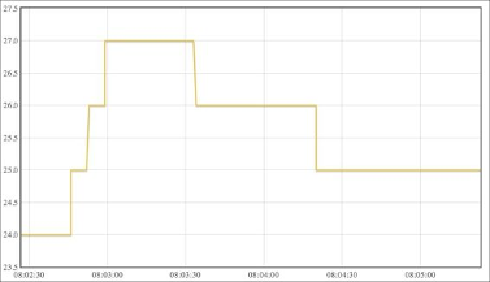
should immediately see that data is being plotted inside your web browser. After a while,
you should get a graph similar to the following graph:
If you can see this plot in your browser, congratulations! This means you can perform re-
mote measurements from the web server running on your Arduino board.

