Graphics Reference
In-Depth Information
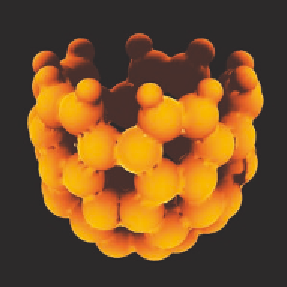
Figure 15.36.
A carbon-50 (buckyball) molecule without (left) and with (right) silhouetes.
Hedgehog Plots
The
hedgehog plot
is a visualization technique that uses a series of spikes per-
pendicular to a surface to give a sense of the shape of that surface. In computer
graphics, we often use flat surfaces with different normals at the vertices, com-
bined with smooth shading, to give the appearance of smooth surfaces. Using
a geometry shader, we can also use the same input to create these spikes and
produce a hedgehog plot of the surface.
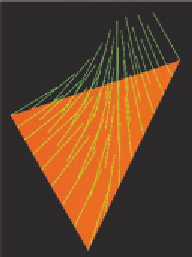
The basic idea is shown in Figure 15.37. A triangle with separate normals
at its vertices is passed to a geometry shader. The geometry shader then subdi-
vides the triangle and interpolates the normals for each vertex in the new tri-
angles, and also creates the line segments for the spikes. This is progressively
shown from left to right as additional subdivisions are created.
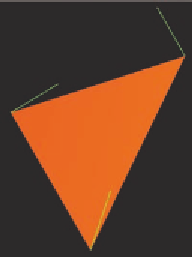
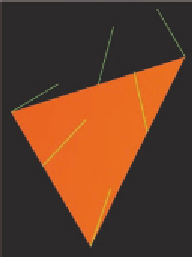
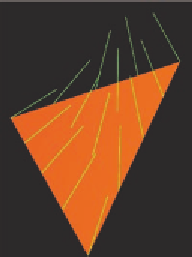
Figure 15.37.
The original triangle with vertex normals (left) and with additional normals as the triangle is
subdivided.