Graphics Reference
In-Depth Information
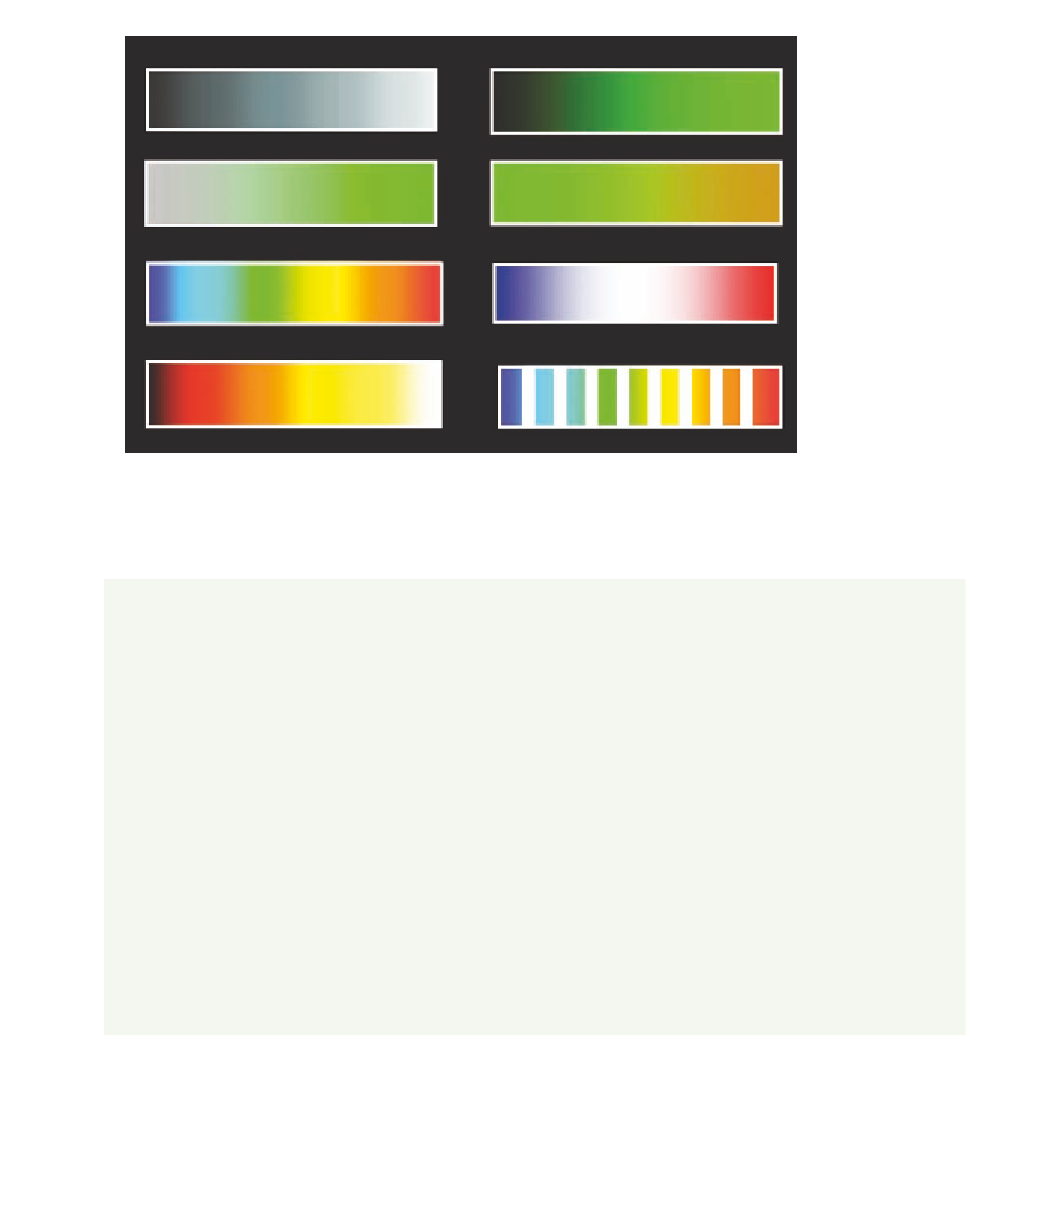
Figure 15.22.
A gallery of color mappings.
Color Mapping
Comments
Grayscale
Black on one end and white on the other. It is simple and unambiguous. An
example use is in x-rays.
Brightness
Black on one end and a solid color on the other.
Saturation
Gray on one end and a solid color on the other. Sometimes this is used to rep-
resent the validity or confidence of the data. The grayest areas are the areas of
least confidence.
Two-color
Interpolation between multiple colors. This is often used on maps to show
transitions from, say, desert to vegetation.
Rainbow
Mimics the visible portion of the electromagnetic spectrum. This is very com-
mon to anyone who learned the ROYGBIV color mnemonic in grade school.
Two-color with a
neutral crossing
Common where crossing from one side to the other needs to convey a sense
of neutrality, such as electrical charge in a molecule.
Heated object
The range of colors that you would see if you continuously heated a piece of
metal. It goes from black to red to yellow to white. Star temperatures work
this way too.
Contours
Involves artificially adding a set of lines into a color scale. This then shows up
in your data as a set of contour lines.
Table 15.1.
Some common color mappings and their common meanings.


