Graphics Reference
In-Depth Information
fer functions and to carry out flow visualization, and using geometry shader
techniques. This includes the whole range of shader techniques in the topic,
showing just how deeply shader programming has affected computer graph-
ics applications.
Image-Based Visualization Techniques
The first few visualization techniques we describe are image based. They have
already been covered in Chapter 10 on image manipulation, but it is useful to
repeat them again here as we look at how they impact the understanding of
data.
Image Negative
The first method displays the negative of an image. This is the most simple of
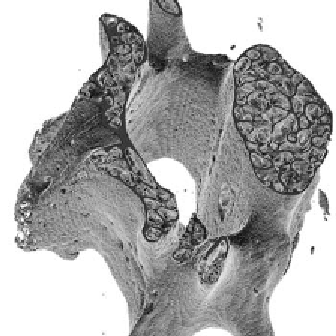
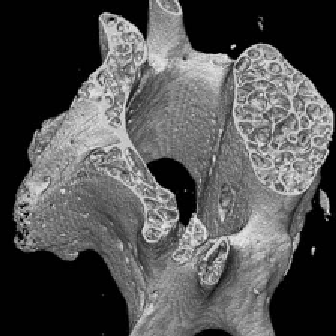
the image shaders, but its use in visualization is surprisingly useful. Figure 15.1
shows a visualization image (a volume rendering, actually) of a mouse verte-
bra. The left-hand image in the figure is the original, and the right-hand one is
the negative. Notice how the negative brings out subtle details that were not
obvious in the original, especially the “pock marks” on the wall of the bone.
Many visualization programs have a “display negative” buton in their user
interface for just this reason.
Figure 15.1.
The original (left) and negative (right) of an image, showing how the negative
often brings out new features.