Graphics Reference
In-Depth Information
Isolines
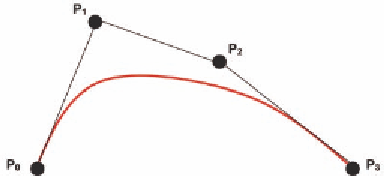
The first example uses tessellation shaders with isolines to create a familiar
Bézier cubic curve with four control points, as shown in Figure 13.7. This curve
is given by the equation
P
(
u
) = (1 −
u
)
3
P
0
+ 3
u
(1 −
u
)
2
P
1
+ 3
u
2
(1 −
u
)
P
2
+
u
3
P
3
,
(1)
where
u
is the single curve parameter and the polynomials (1 −
u
)
3
, 3
u
(1 −
u
)
2
,
3
u
2
(1 −
u
), and
u
3
are the standard Bernstein basis functions for Bézier curves.
The tessellation control shader (TCS)
figures out how much to tessellate the curve
based on screen area, curvature, or other
factors. The tessellation primitive genera-
tor (TPG) generates
u
(or [
u
,
v
,
w
]) values for
as many subdivisions as the TCS asked for,
and the tessellation evaluation shader com-
putes the (
x
,
y
,
z
) coordinates based on the
TPG's
u
values, using the equation derived
by expanding (1):
Figure 13.7.
A Bezier curve with four control points.
P
(
u
) =
u
3
(−
P
0
+ 3
P
1
− 3
P
2
+
P
3
) +
u
2
(3
P
0
− 6
P
1
+ 3
P
2
) +
u
(−3
P
0
+ 3
P
1
) +
P
0
. (2)
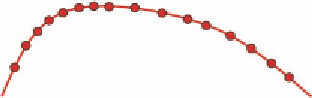
The final result is to be the familiar curve shown in Figure 13.8.
To show how to generate the tessellated figure
from the given control points, we will show several
pieces of code: the first is some code you would place
in your main program, the second is the .glib file you
would use to set up this example through
glman
, the
third is the TCS shader file, and the fourth is the TES
shader file.
Some code you might place in your main program is
Figure 13.8.
The Bézier curve with its
positions at uniform values of
u
.
glPatchParameteri( GL_PATCH_VERTICES, 4 );
glBegin( GL_PATCHES );
glVertex3f( x0, y0, z0 );
glVertex3f( x1, y1, z1 );
glVertex3f( x2, y2, z2 );
glVertex3f( x3, y3, z3 );
glEnd( );
5
5.
You can also use GL_PATCHES with vertex arrays and vertex buffer objects.