Graphics Reference
In-Depth Information
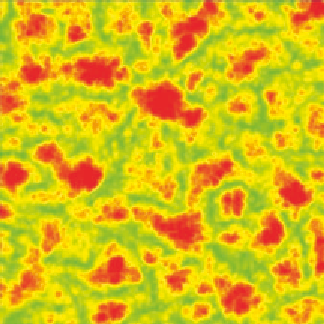
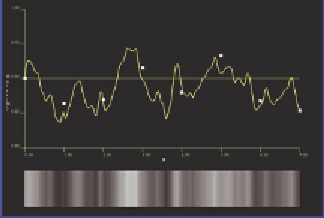
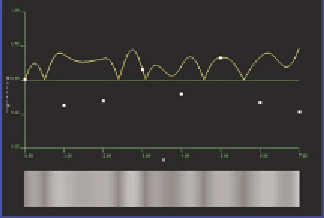
Figure 10.9.
Comparing the appearance of a 1D 1-octave noise function (top left), with the
turbulence function derived from it (top right); a 1D 4-octave noise function (middle left),
with the turbulence function derived from it (middle right); and the same comparison with
a 2D 4-octave noise function (botom left and right).
tion. For example, the noise functions shown by
noisegraph
in Figure 10.9, a
one-octave and a four-octave 1D cubic noise+gradient noise function and their
absolute values, along with the four-octave 2D examples, illustrate the differ-
ence between these two kinds of noise. It is possible to have more than four
octaves of noise, and
noisegraph
can provide up to eight octaves. Because the