Graphics Reference
In-Depth Information
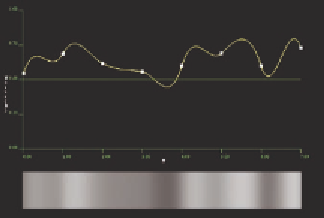
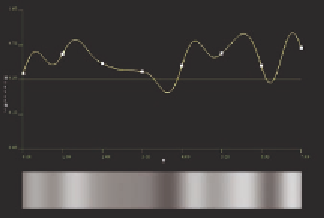
tic interpolation
. Quintic interpolations are similar, but
they use a fifth-degree polynomial basis rather than
a cubic polynomial basis. The difference between the
two interpolations may be subtle; you will need to look
closely at the two value+gradient noise functions from
noisegraph
in Figure 10.2 to see any difference. Cubic
interpolations are
C
1
continuous (the curve has con-
tinuous slope), while quintic interpolations are
C
2
con-
tinuous (the curve has both continuous slope and con-
tinuous curvature) and thus are smoother. One way to
think of the difference is that quintic functions main-
tain the curvature continuity at each connection point
by enlarging the overshoot there, not unlike racing past
second base in baseball. See [35] for a more complete
discussion.
Noise Equations
The key to understanding the derivation of the noise
functions is realizing that they are polynomial func-
tions whose coefficients are determined by the noise
properties you are using. Let's begin with cubic noise
functions and then go on to quintic functions.
Any cubic function of a single variable is given by a general cubic expres-
sion as
Figure 10.2.
Cubic (top) and quintic
(botom) value+gradient interpolations
on the same basis.
()
=+++
2
3
.
Nt ABtCt t
This expression gives the value, or position, of the function for any para-
metric value
t
. Because this expression has four unknowns, we need four
known quantities to determine them.
Now if we take the derivative of this expression, we get the gradient
dN
dt
B t t
==+23
2
Gt
()
.
If we consider the values of the function and gradient at the endpoints of
the interval [0,1] in the parameter
t
,
(
)
==
(
)
NNt
==
0
N Nt
1
0
1
(
)
==
(
)
GGt
==
0
G Gt
1
0
1