Graphics Reference
In-Depth Information
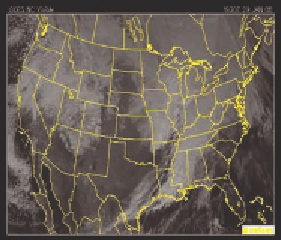
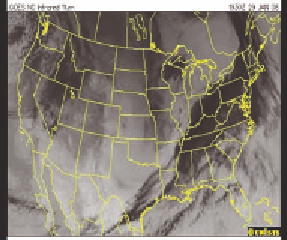
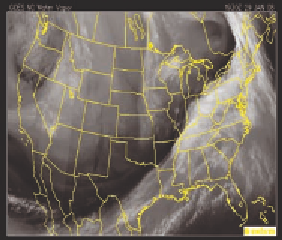
Figure 8.9.
Three GOES satellite views from space: visible light (left); infrared (center); water vapor concen-
tration (right).
Suppose we wanted to ask for the areas in which snow is most likely.
We would infer that these areas are where the water vapor concentration is
high and the infrared is low. It is difficult to eyeball this from the images in
Figure 8.9, but if you read the visible, infrared, and water vapor from three
textures into
visibleLightColor
,
infraredInten
and
watervaporInten
, and
read two thresholds,
InfraRedThreshold
and
WaterVaporTheshold
, as uni-
form variables, it is straightforward to write these criteria into a fragment
shader, as shown in the fragment shader here:
vec3 rgb = visibleLightColor;
. . .
if( infraredInten < InfraRedThreshold && // cold
watervaporInten > WaterVaporThreshold ) // damp
rgb = vec3( 0., 1., 0. ); // “likely snow” = green
fFragColor = vec4( rgb, 1. );
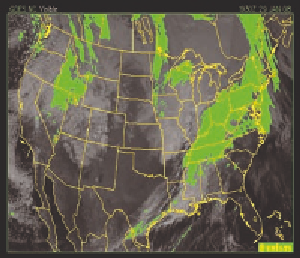
The image generated from this shader
is shown in Figure 8.10. Note that this
gives a fairly obvious representation of
the three major storm systems that were
moving through the United States that
day. Making this a real weather forecast-
ing tool would require applying more
science to determine what the appropri-
ate cutoff values for moisture and infra-
red should be, along with studying other
factors that might be included. But this
image by itself is very useful.
Figure 8.10.
Using a fragment shader
to locate all areas with high water
vapor concentration and low infrared.