Information Technology Reference
In-Depth Information
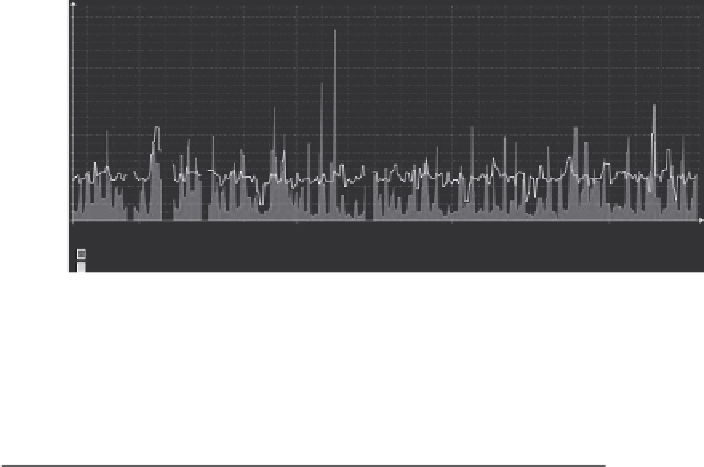
10.2.2.208 R210 - Tra
c - eth 0 - day (5 min avg)
240 k
220 k
200 k
180 k
160 k
140 k
120 k
100 k
80 k
60 k
40 k
20 k
0
10:00
12:00
14:00
16:00
18:00
20:00
22:00 0:00
02:00
04:00 6:00
08:00
Outgoing
Incoming
To tal Trac
Max:
Max:
In:
225.01 kb/s
136.27 kb/s
542.25 MB
Avg:
Avg:
Out:
36.55 kb/s
52.77 kb/s
375.59 MB
Last:
Last:
Combined:
55.54 kb/s
52.72 kb/s
917.84 MB
FIGURE 8.17
Inbound and outbound traffic of the network for uploading. (Redrawn from Fan, X., He, C.,
Cai, Y. and Li, Y., in
IEEE CloudCom 2012
, Taipei, December 3-6, 2012, 705-710.)
TABLE 8.3
Uploading Activity Statistic for HTTP Request
500
(Internal
Server Error)
200
(Response Is OK)
302
(Redirect Is OK)
HTTP Status Code
Highest rate (bytes/second)
581.4
1.8
0.1
Total number
158,780
162
1
Finish_users_count (the total number of concurrent connections): 28,170
lasting 30 minutes. Among these 300 users, 100 browsed the left navigate list,
100 visited each icon, and 100 browsed the main content links. In the testing
results shown in Figure 8.18 and Table 8.4, we summarize that the testing
generated 550,636 requests, the number of concurrent connections exceeded
20,000, and each single server traffic spike was approximately 30 Mb/s in
this situation.
8.4.2 Results Evaluation
The connection status and throughput in the simulation provide a view of
the system performance. Further details and evaluation are depicted in this
segment as follows: Table 8.5 shows the details of requests that happened
for uploading and browsing. A new HTTP
request
generated within a given
interval of 0.02 seconds represents that a new user connection happened,
and a
session
will be created according to the probability presented in the
testing configuration file. The mean response time and count (for page,
request, etc.) for the entire test are computed, generating 163,011 and 573,683
concurrent requests for the two activities, respectively, as shown in
Mean

Search WWH ::

Custom Search