Information Technology Reference
In-Depth Information
SBP(mmHg)
DBP(mmHg)
> 140
90-140
< 90
> 90
60-90
< 60
>60
67%
<90
67%
>140
0%
>90
0%
90-140
33%
60-90
33%
PP(mmHg)
>30
33%
> 55
30-55
< 30
Instructions
SBP
Pie Chart of Pulse Pressure
30-55
33%
DBP
??
Pie Chart of Diastolic Pressure
Pie Chart of Pulse Pressure
>55
33%
FIGURE 8.14
Pie chart for HBP index.
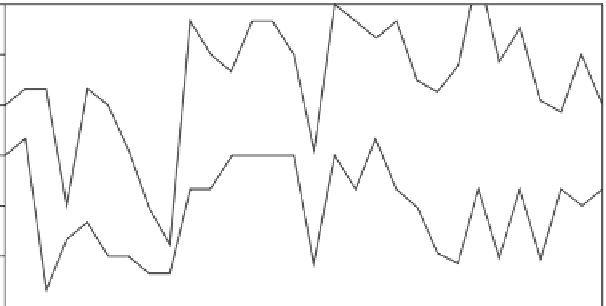
It is extremely important for people to be aware of HBP so there can be
early prevention and timely treatment. In our system, the HBP report is
provided to provide detailed data on systolic and diastolic blood pressure
and inform users whether their blood pressure is high or not. Figure 8.14
shows the distribution of the range of HBP in one period, which helps users
monitor their HBP status. At the same time, it can help a doctor know the
general health state of a patient. A trend chart of HBP (Figure 8.15) shows
which phase blood pressure pills will affect.
210
180
180
160
150
140
120
120
90
90
60
60
30
3
6
9
12
15
18
21
24
27
30
FIG 8.15
Trend chart for HBP.


Search WWH ::

Custom Search