Graphics Programs Reference
In-Depth Information
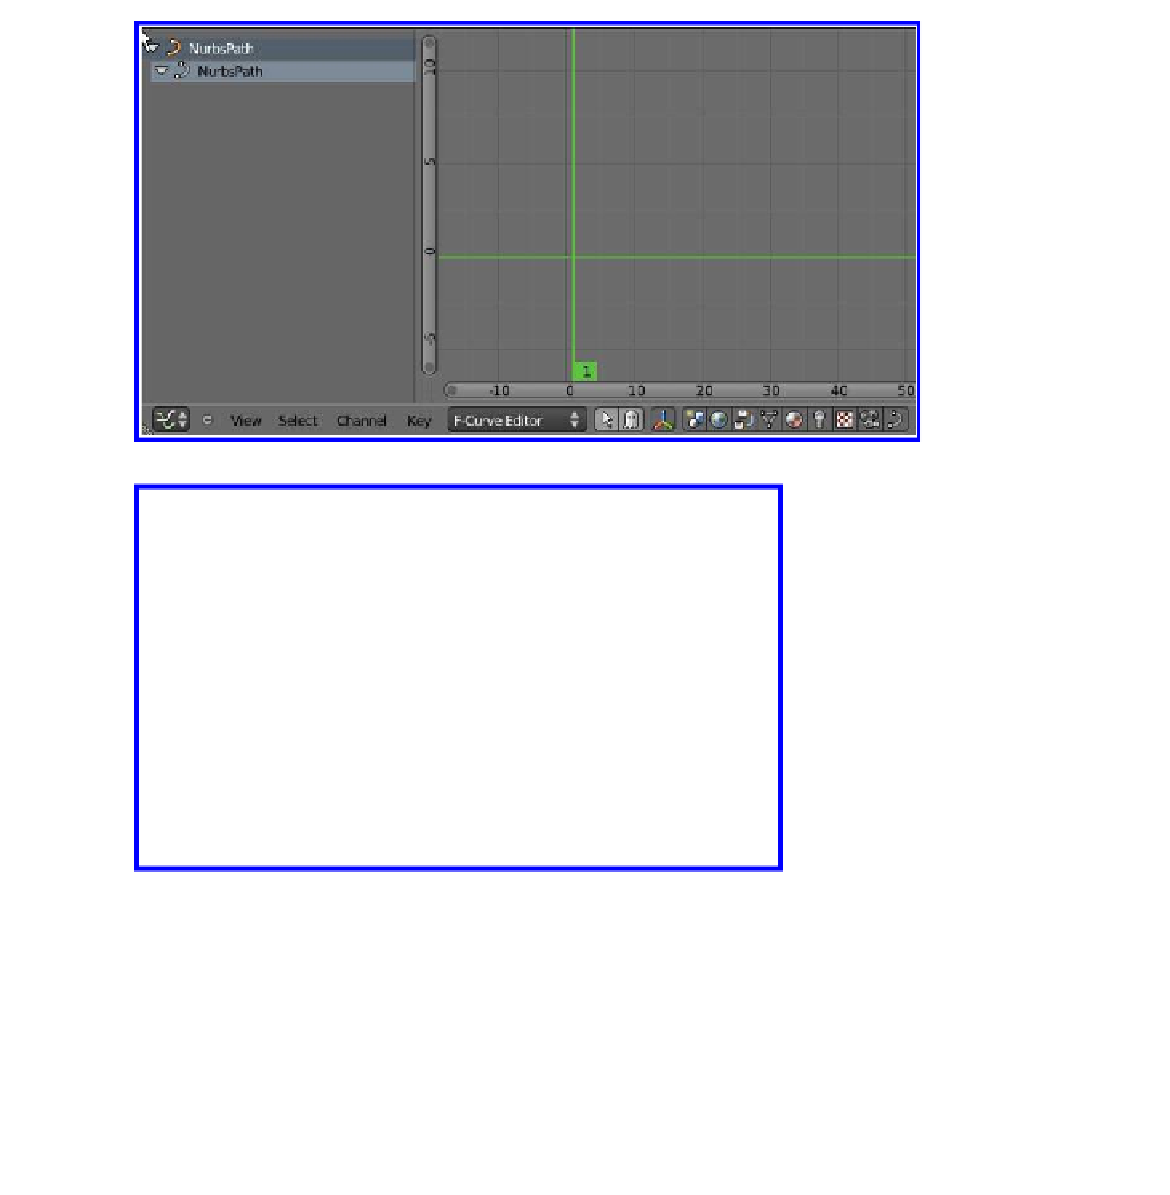
Figure 9.38
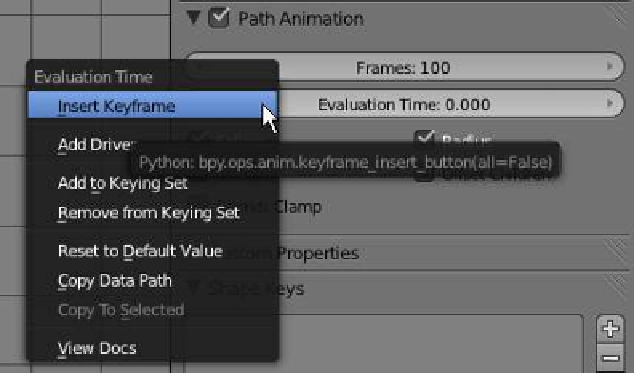
Figure 9.39
The “Evaluation Time” button becomes shaded yellow and an “Evaluation Time” chan-
nel is entered in the dope sheet panel (Figure 9.40). A horizontal red line is drawn in the
graph editor window with a dot under the vertical green line (cursor); the red line is an
animation curve and the dot is a key frame at frame 1.
In the timeline window, move the cursor to frame 150. We will make the cube move
along the path in 150 frames. Change the “Evaluation Time” value to 100 to place the
cube at the end of the path—we now have the cube at the end of the path at frame 150
(Figure 9.41). Right click on the “Evaluation Time” button and insert another key frame. Zoom
in on the graph editor window and you will see a second key frame entered above the first at
frame 150. The key frames now have handles attached showing that the animation curve is a