Geography Reference
In-Depth Information
Egypt in the year 2010 is 2599 per square kilometer
(5717 per sq mi). This number is far more reflective of
Egypt's population pressure, and it continues to rise
rapidly despite Egypt's efforts to expand its irrigated
farmlands.
Appendix B (at the end of this topic) provides
complete data on both arithmetic and physiologic pop-
ulation densities, and some of the data stand out mark-
edly. Mountainous Switzerland's physiologic density is
10 times as high as its arithmetic density because only 1
out of every 10 acres in Switzerland is arable. Ukraine's
population is 45,600,000 and its arithmetic density
(population per sq km) is 76. Ukraine has vast farm-
lands which make its physiologic density 128 people
per sq km of arable land. When comparing arithmetic
density and physiologic density, the total number of
people stays the same, and the only number that
changes in calculating each is the amount of land. The
difference in arithmetic density and physiologic den-
sity for a single country reveals the proportion of arable
land to all land. In the case of Ukraine, the physiologic
density is 1.68 times as high as the arithmetic density
because 1 out of every 1.68 acres of land in Ukraine
is arable.
In Appendix B, the countries and territories of
Middle America and the Caribbean stand out as having
high physiologic densities compared to the moderate
physiologic densities for South America. India's physi-
olog density is the lowest in South Asia despite its huge
population. Both China and India have populations well
over 1 billion, but according to the physiologic density,
India has much more arable land per person than China.
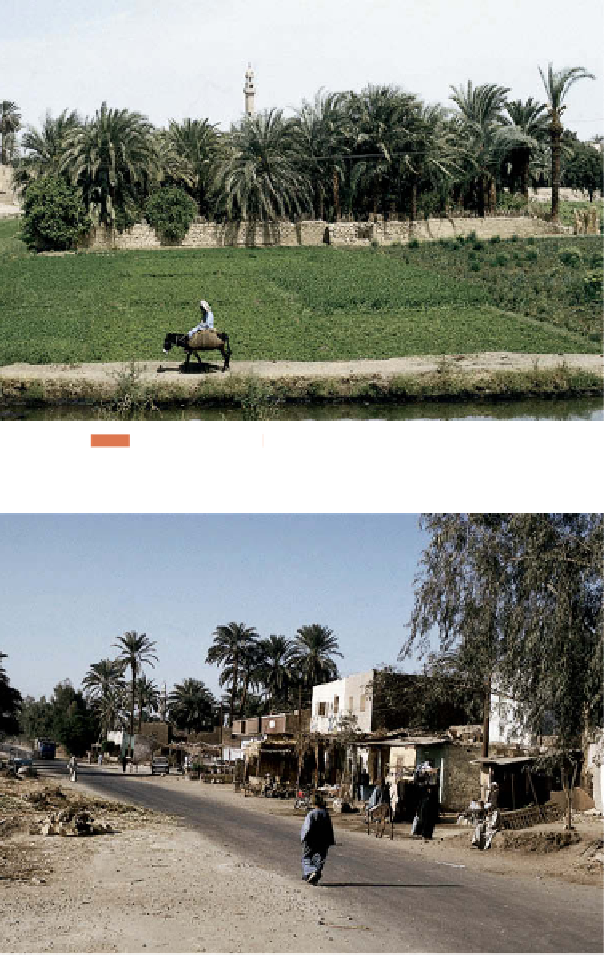
Field Note
“The contrasting character of the Egyptian landscape could
not be more striking. Along the Nile River, the landscape is
one of green fi elds, scattered trees, and modest houses, as
along this stretch of the river's west bank near Luxor (Fig. 2.4
top). But anytime I wander away from the river, brown, wind-
sculpted sand dominates the scene as far as the eye can see
(Fig. 2.4 bottom). Where people live and what they do is not
just a product of culture; it is shaped by the physical envi-
ronment as well.”
Figure 2.4 top
Luxor, Egypt.
© Alexander B. Murphy.
Population Distribution
People are not distributed evenly across the world or
within a country. One-third of the world's population
lives in China and India. Yet, each country has large
expanses of land (the Himalayas in India and a vast inte-
rior desert in China) where people are absent or sparsely
distributed. In addition to studying population densi-
ties, geographers study
population distributions
—
descriptions of locations on the Earth's surface where
individuals or groups (depending on the scale) live.
Geographers often represent population distributions
on
dot maps
, in which one dot represents a certain
number of a population. At the local scale, a dot map
of population can show each individual farm in a
sparsely populated rural area. At the global scale, the
data are much more generalized. In the following sec-
tion of this chapter, we study world population distri-
bution and density.
Figure 2.4 bottom
Luxor, Egypt.
© Alexander B. Murphy.