Geography Reference
In-Depth Information
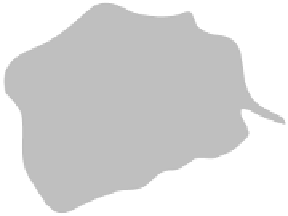
ASIA
Barents
Sea
Laptev
Sea
EUROPE
East Siberian
Sea
Norwegian
Sea
ARCTIC
OCEAN
North Pole
Bering
Sea
Greenland
Sea
Chukchi
Sea
Beaufort
Sea
Limits of
projection
Baffin
Bay
Gulf of
Alaska
Davis
Strait
NORTH AMERICA
ATLANTIC OCEAN
120°W
90°W
60°W
Bellingshausen
Sea
Larsen
Ice
Shelf
Amundsen
Sea
150°W
30°W
Weddel
Sea
Filchner
Ice
Shelf
Ross
Sea
Ross Ice
Shelf
180°W
0°
South Pole
ANTARCTICA
30°E
150°E
Amery
Ice
Shelf
120°E
90°E
60°E
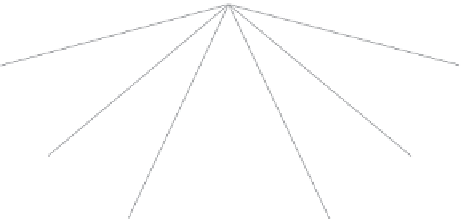
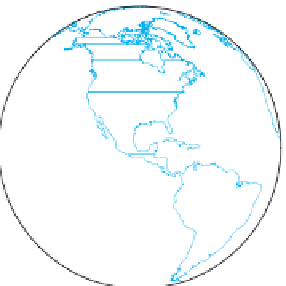
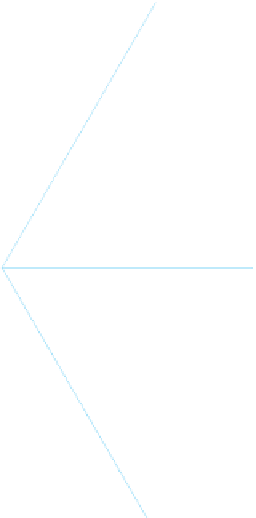
Figure A.8
A Planar projection
is created when a light at the center of the
globe projects diverging longitude lines onto a fl at sheet of paper
placed over the North Pole (top) and the South Pole (bottom).
© H. J. de Blij, P. O. Muller, and John Wiley & Sons, Inc.
specialized cartography in such fi elds as geology and me-
teorology. Nevertheless, it is useful to know why symbols
such as those used on the maps in this topic were chosen.
Point symbols, as we noted, are used to show individ-
ual features or places. On a large-scale map of a city, dots
can represent individual houses or locations of businesses. A
dot map shows a spatial distribution, such as the distribution
of Starbucks coffee shops in Washington, D.C. (Fig. A.9).
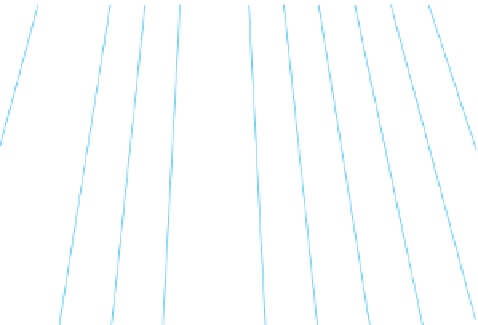
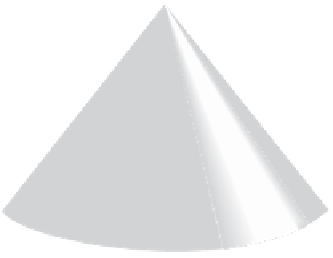
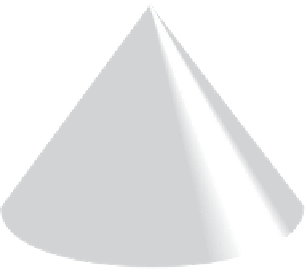
Figure A.7
Construction of a
conic projection.