Geography Reference
In-Depth Information
80°N
80°N
60°N
40°N
40°N
20°N
20°N
0°
0°
160°W
140°W
120°W
100°W
20°W
0°
60°E
80°E
160°E
20°S
20°S
40°S
60°S
60°S
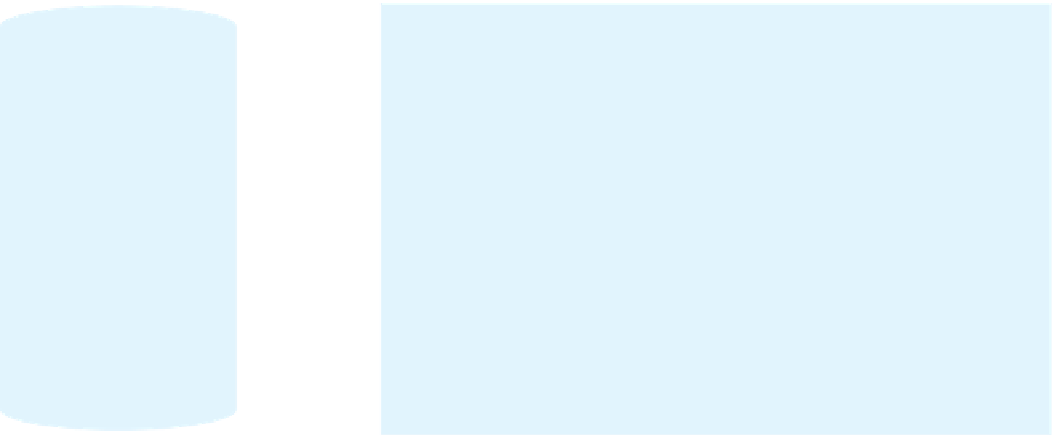
Figure A.5
The Robinson projection
substantially reduces the exaggerated size of polar landmasses
because the lines of longitude curve toward each other in the polar regions. The Robinson pro-
jection better approximates shape, but it lacks the directional utility of the Mercator projection.
SYMBOLS ON MAPS
The third fundamental property of a map is its sym-
bolization. Maps represent the real world, and this can be
done only through the use of symbols. Anyone who has
used an atlas map is familiar with some of these symbols:
prominent dots (perhaps black or red) for cities; a large dot
with a circle around it, or a star, for capitals; red lines for
roads, double lines for four-lane highways, black lines for
railroads; and patterns or colors for areas of water, forest, or
farmland. Notice that these symbols respectively represent
points, lines, and areas on the ground. For our purposes,
we need not go further into map symbolization, which
can become a very complex topic when it comes to highly
Arctic Circle
60°N
40°N
Tropic of Cancer
20°N
Equator
0°
20°S
Tropic of Capricorn
40°S
60°S
160°W
140°W
120°W
100°W
80°W
40°W
20°W
0°
20°E
40°E
60°E
80°E
100°E
120°E
140°E
160°E
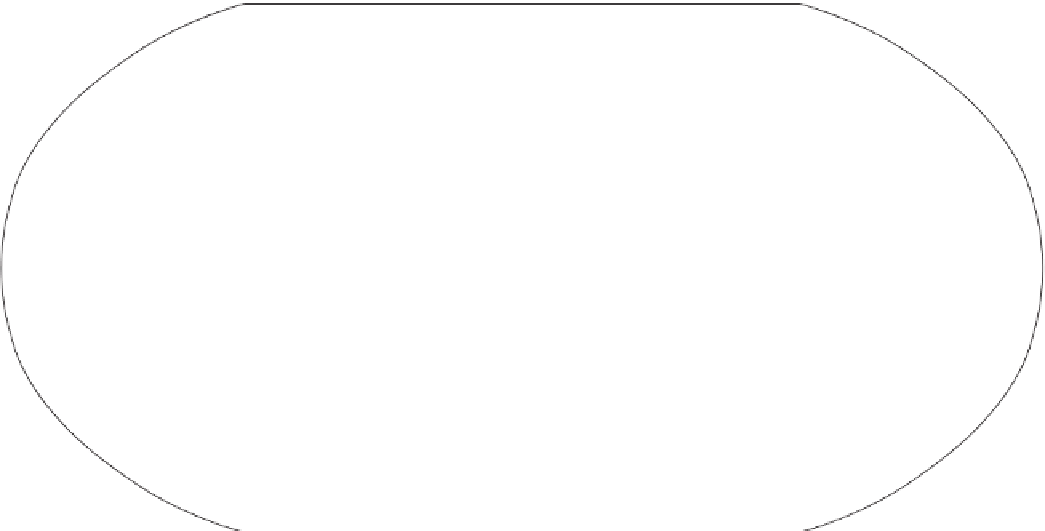
Figure A.6
A Cylindrical projection
is created by projecting the grid lines of a globe onto paper that is
wrapped around the globe.