Geography Reference
In-Depth Information
Arctic Circle
60
°
60
°
60
°
ATLANTIC
OCEAN
40
°
40
°
40
°
40
°
ATLANTIC
OCEAN
PACIFIC
Tropic of Cancer
Tropic of Cancer
20
°
20
°
20
°
20
°
OCEAN
PACIFIC
OCEAN
INDIAN
OCEAN
Equator
Equator
0
°
0
°
160
°
140
°
120
°
ATLANTIC
CARBON DIOXIDE EMISSIONS
PER CAPITA IN METRIC TONS (2004)
20
°
20
°
20
°
20
°
20
°
20
°
Tropic of Capricorn
OCEAN
8.76 - 21.0
4.18 - 8.76
1.55 - 4.18
0.45 - 1.54
0.00 - 0.44
No data
40
°
40
°
40
°
40
°
40
°
80
°
60
°
40
°
0
°
20
°
40
°
60
°
100
°
120
°
140
°
160
°
60
60
60
60
60
60
°
°
°
°
°
°
SOUTHERN
OCEAN
0
2000
4000
6000 Kilometers
Antarctic Circle
0
2000
4000 Miles
Figure 13.22
Carbon Dioxide Emissions per Capita, 2004.
Recently, China's total carbon dioxide emis-
sions exceeded those of the United States. However, in per capita emissions of carbon dioxide,
mapped here, the United States, Canada, and the United Arab Emirates are the highest.
Data
from:
United Nations Development Programme, Human Development Report, 2007/2008.
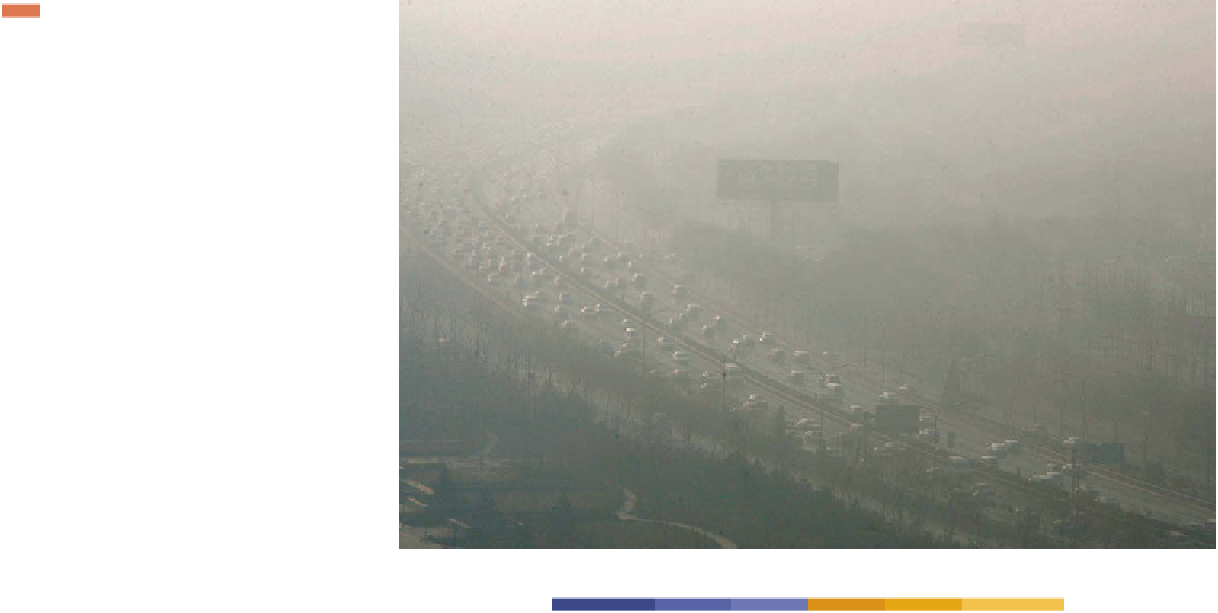
Figure 13.23
Beijing, China.
Smog covers the traffi c on
a motorway in the central business districts of
Beijing just a few months before the opening
of the 2008 Olympics in Beijing.
© David G.
McIntyre/epa/Corbis.
continuing to prioritize economic concerns over efforts
to make serious inroads in the reduction of greenhouse
gases, there is much doubt as to whether signifi cant
progress will be made in confronting the human role
in climate change. Hence, policy makers and scientists
are increasingly focusing their attention on adaptation
strategies.
Examine the map of global carbon dioxide emissions and
explain the pattern you see. What other geographic pat-
terns are correlated with those shown in the map?